
Fig. 6
- ID
- ZDB-FIG-230325-37
- Publication
- Myren-Svelstad et al., 2022 - Elevated photic response is followed by a rapid decay and depressed state in ictogenic networks
- Other Figures
- All Figure Page
- Back to All Figure Page
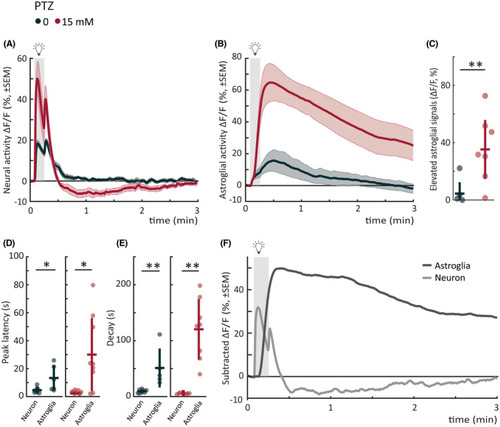
Astroglial photic response in seizure‐prone networks is slow, elevated, and mirrors neural depressed state. (A) Mean neural calcium response (relative change in fluorescence [ΔF/F; %]) to photic stimulation per subgroup averaged across five trials of 5‐min interstimulus interval. Gray shaded area indicates photic stimulation. The same dataset as in Figure 4A pentylenetetrazole (PTZ) trials is replotted for comparison with astroglial signals. (B) Mean astroglial calcium response (∆F/F) to photic stimulation per subgroup averaged across five trials of 5‐min interstimulus interval. Gray shaded area indicates photic stimulation. (C) Elevated astroglial signals as measured by mean area under the curve from a 5‐s baseline (5‐min period after light onset). (D) Latency to peak amplitude of response during 10‐s photic stimulation. Left panel shows neural versus astroglial responses for control; right panel shows the responses for 15 mmol·L−1 PTZ. (E) Time constant for 50% decay of calcium signal from light offset. Left panel shows neural versus astroglial responses for control; right panel shows the responses for 15 mmol·L−1 PTZ. (F) Mean calcium response (∆F/F) of control fish subtracted from mean response of 15 mmol·L−1 fish for astroglia (dark gray) versus neuron (light gray). Pearson correlation coefficient between average astroglial and neural signal is −.5403, calculated from time point of neural light‐on response peak until next light stimulus. Gray shaded area indicates photic stimulation. Total sample size for Tg(GFAP:Gal4);Tg(UAS:GCaMP6s) "astroglial" recordings: control, n = 7; 15 mmol·L−1, n = 9; for Tg(elavl3:GCaMP6s) "neural" recordings: control, n = 8; 15 mmol·L−1, n = 10. *p < .05, **p < .01 by Wilcoxon rank‐sum test. Each data point in scatter plots represents an individual fish. Error bars represent mean ± SD per subgroup. Shaded regions of individual colors represent SEM of each group. |