
Fig. 5
- ID
- ZDB-FIG-230325-36
- Publication
- Myren-Svelstad et al., 2022 - Elevated photic response is followed by a rapid decay and depressed state in ictogenic networks
- Other Figures
- All Figure Page
- Back to All Figure Page
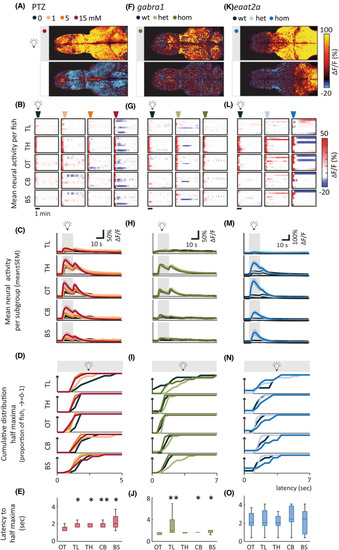
Brain regions are differentially recruited upon photic stimulation. (A, F, K) Representative examples of fish during periods when light was turned on and off. Images show mean calcium signals (relative change in fluorescence [ΔF/F; %]) averaged across five trials. Upper panels show a time period starting 5 s after light onset, lower panels from 30 s after light offset. Both show the average activity during a 1.68‐s period. (B, G, L) Average calcium signals were extracted from five brain regions: telencephalon (TL), thalamus (TH), optic tectum (OT), cerebellum (CB), and brainstem (BS). Each line in heatmaps represents ∆F/F of one fish averaged across five trials of 5‐min interstimulus interval. (C, H, M) Average activity per subgroup, ∆F/F. (D, I, N) Cumulative distribution of latency to half maxima during photic stimulation. (E, J, O) Latency to half maxima for 15 mmol·L−1 pentylenetetrazole (PTZ; E), homozygous (hom) gabra1 mutants (J), and hom eaat2 mutants (O). Latency for optic tectum is compared with the four other brain regions. Total sample size for PTZ model: control, n = 8; 1 mmol·L−1, n = 7; 5 mmol·L−1, n = 9; 15 mmol·L−1, n = 10; for gabra1 model: wild‐type (wt), n = 9; heterozygous (het), n = 13; hom, n = 9; for eaat2a model: wt, n = 7; het, n = 13; hom, n = 11. For eaat2a hom mutants, four of 11 animals had only plateaulike events; hence, seven animals were included in the analyses for this figure. Shaded regions of individual colors represent SEM of each group. *p < .05, **p < .01 by Wilcoxon rank‐sum test. Boxplots represent median with interquartile ranges; whiskers extend to the most extreme data points that are not outliers |