
Fig. 1
- ID
- ZDB-FIG-230325-32
- Publication
- Myren-Svelstad et al., 2022 - Elevated photic response is followed by a rapid decay and depressed state in ictogenic networks
- Other Figures
- All Figure Page
- Back to All Figure Page
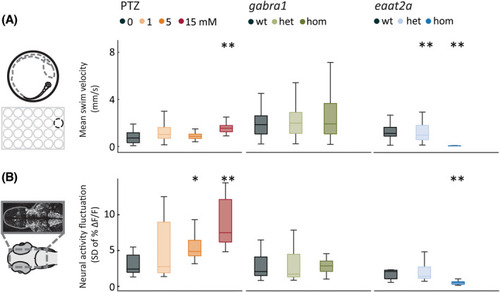
Spontaneous locomotor and neural activity display a hypoactive or hyperactive model‐dependent phenotype. (A) Locomotor behavior was recorded in a 24‐well plate. Mean swim velocity was calculated per 1‐s time bin during 1‐h baseline recordings in the pentylenetetrazole (PTZ), gabra1, and eaat2a models. (B) Neural activity fluctuation was calculated as the SD of relative change in fluorescence (ΔF/F; %) during the last 2 min of 1‐h recordings in 5‐day‐old Tg(elavl3:GCaMP6s) zebrafish larvae. Total sample size for behavioral experiments for PTZ model: control, n = 48; 1 mmol·L−1, n = 48; 5 mmol·L−1, n = 48; 15 mmol·L−1, n = 48; for gabra1 model: wild‐type (wt), n = 39; heterozygous (het), n = 81; homozygous (hom), n = 48; for eaat2a model: wt, n = 11; het, n = 41; hom, n = 42. Total sample size for calcium recordings for PTZ model: control, n = 8; 1 mmol·L−1, n = 7; 5 mmol·L−1, n = 9; 15 mmol·L−1, n = 10; for gabra1 model: wt, n = 9; het, n = 13; hom, n = 9; for eaat2a model: wt, n = 7; het, n = 13; hom, n = 11. *p < .05, **p < .01 by Wilcoxon rank‐sum test. Boxplots represent median with interquartile ranges; whiskers extend to the most extreme data points that are not outliers |