
Figure 3.
- ID
- ZDB-FIG-230217-199
- Publication
- Xue et al., 2023 - Lack of Paxillin phosphorylation promotes single-cell migration in vivo
- Other Figures
- All Figure Page
- Back to All Figure Page
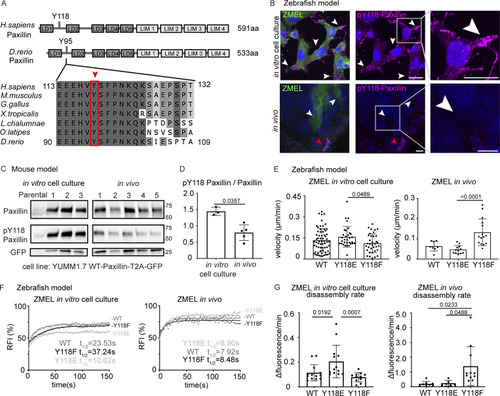
Paxillin exhibits reduced phosphorylation on Y118 in migrating cancer cells in vivo as compared to in vitro cell culture conditions in both zebrafish and mouse melanoma models. (A) Schematic of protein structures of human and zebrafish Paxillin (top) and amino acid sequence comparisons of the region encompassing Y118 between zebrafish Paxillin and vertebrate Paxillin (bottom). Red arrowhead and box indicate the conservation of Y118 Paxillin between zebrafish and other vertebrates. (B) Top: Endogenous pY118-Paxillin staining (magenta) of ZMEL-GFP (GFP immunostaining, green) plated on 2D in vitro cell culture dishes. White arrowheads mark positive pY118-Paxillin staining. Bottom: Endogenous pY118-Paxillin staining (magenta) of ZMEL-mCherry (mCherry immunostaining, pseudo-colored green, white arrowheads) in larval zebrafish (3 d post-transplantation). Red arrowhead indicates a non-ZMEL cell with positive pY118-Paxillin immunostaining. Zoomed regions reveal pY118-Paxillin immunostaining only. Scale bar is 10 µm. (C) Western blot analysis of mouse melanoma YUMM1.7 cells expressing mammalian WT-Paxillin-T2A-GFP plated on the in vitro cell culture dishes (n = 3 dishes) and YUMM1.7 melanoma in vivo tumors (n = 5 tumors). In vitro and in vivo bands are from the same blot—see unmodified Western blot in Fig. S2 D. GFP was used as the loading control and a control for the number of YUMM1.7 cells in mouse tumors. (D) Quantification of pY118-Paxillin/total Paxillin protein ratio from C. Non-parametric unpaired t-test. (E) Quantification of single cell migration velocity in ZMEL-mCherry cells that exogenously express GFP-tagged zebrafish WT-Paxillin, Y118E-Paxillin, or Y118F-Paxillin in the in vitro cell culture conditions (n = 64 cells for WT, n = 32 cells for Y118E, and n = 35 cells for Y118F) and in vivo (n = 8 cells/3 fish for WT, n = 12 cells/3 fish for Y118E, and n = 15 cells/3 fish for Y118F). Larval zebrafish are imaged 1 d post-transplantation. Non-parametric one-way ANOVA, error bars are mean ± SD. (F) Cumulative FRAP recovery curves of WT-Paxillin-EGFP, Y118E-Paxillin-EGFP, or Y118F-Paxillin-EGFP in ZMEL cells in the in vitro cell culture conditions and in vivo after photobleaching. n = 34, 44, and 51 cells for WT, Y118E, Y118F in vitro, and n = 7 cells/6 fish, 6 cells/6 fish, and 6 cells/5 fish for WT, Y118E, Y118F in vivo. (G) Quantification of Paxillin disassembly rates in the WT, Y118E, Y118F-Paxilllin under in vitro cell culture conditions and WT, Y118E, Y118F-Paxilllin under in vivo conditions. n = 13, 13, and 11 cells for WT, Y118E, Y118F in vitro, and n = 8 cells/7 fish, 6 cells/6 fish, 11 cells/10 fish for WT, Y118E, Y118F in vivo. Error bars are mean ± SD. Non-parametric unpaired t test. Source data are available for this figure: SourceData F3. |