
Figure 1.
- ID
- ZDB-FIG-230217-196
- Publication
- Xue et al., 2023 - Lack of Paxillin phosphorylation promotes single-cell migration in vivo
- Other Figures
- All Figure Page
- Back to All Figure Page
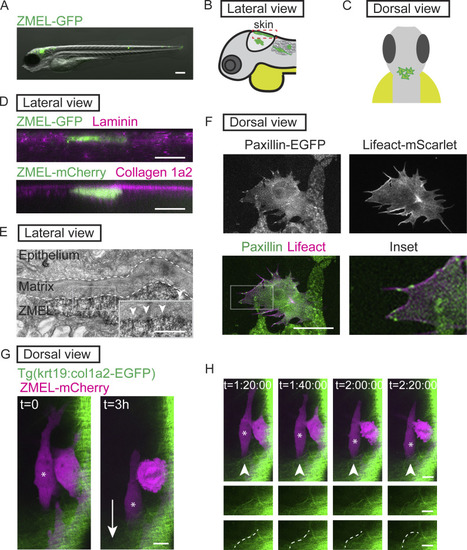
Transplanted ZMEL cells form focal adhesions structures during single-cell migration in vivo. (A) Representative image of ZMEL-GFP whole body dissemination in a 5 dpf (3 d post-transplantation) larval zebrafish. Scale bar is 100 µm. (B and C) Schematic of two imaging views to visualize transplanted ZMEL cells that attach to the zebrafish skin. Lateral view (B); dashed red box indicates skin region; dorsal view (C). (D) Upper panel: Lateral view of a fixed zebrafish larva with transplanted ZMEL-GFP cells (GFP immunostaining, green) in close proximity with laminin (magenta). Lower panel: Lateral view of a live larva with transplanted ZMEL-mCherry cells (pseudocolored in green) that is proximal to collagen labeled with Tg(krt19:col1a2-GFP)zj502 (pseudocolored in magenta). Scale bar is 10 µm. (E) TEM micrograph of a ZMEL cell transplanted in a larval zebrafish (3 d post-transplantation), lateral view. Dashed white lines outline the skin ECM, with a pigmented ZMEL cell underneath the matrix (labeled “ZMEL”). The inset is a magnification of the grey box revealing the ZMEL–matrix interface. Arrowheads mark the electron-dense regions where ZMEL cells contact the matrix. Scale bar is 1 µm. See also Fig. S1 B for non-ZMEL containing control larvae. (F) Live imaging of transplanted ZMEL cells co-expressing zebrafish Paxillin-EGFP (green in overlay and inset) and Lifeact-mScarlet (magenta in overlay and inset) in the zebrafish skin. Inset is the magnified image of the grey box in the overlay. Dorsal imaging view. Scale bar is 10 µm. See also Video 1. (G) Start and end frames from a timelapse video of transplanted ZMEL-mCherry cells (magenta) migrating in the zebrafish skin with collagen (green) labeled with Tg(krt19:col1a2-GFP)zj502. Arrow indicates the direction of migration, and the migrating ZMEL cells are marked with an asterisk. Scale bar is 10 µm. (H) Still images of timelapse video in G. Arrowheads mark a collagen fiber (green) that is buckling as ZMEL cells (magenta, asterisk) migrate. Middle row shows the magnified images of collagen fibers. Bottom row highlights the buckling collagen fiber overlaid with a dashed white line. See also Video 2. |