
Figure 2.
- ID
- ZDB-FIG-230217-198
- Publication
- Xue et al., 2023 - Lack of Paxillin phosphorylation promotes single-cell migration in vivo
- Other Figures
- All Figure Page
- Back to All Figure Page
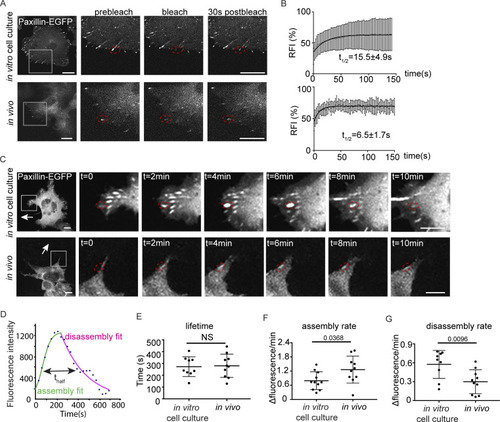
Paxillin exhibits reduced disassembly rates and increased assembly rates at focal adhesions in migrating ZMELs in vivo. (A) Still images of ZMEL Paxillin-EGFP FRAP experiments in vitro and in vivo. Left panel is the whole cell view and the rest of the panels are a magnification of the grey boxes prebleach, upon photobleaching, and 30 s after photobleaching. Red dotted circles mark Paxillin positive punctae that underwent photobleaching. See also Videos 3 and and4.4. (B) Cumulative FRAP recovery curves of Paxillin-EGFP in ZMEL cells in the in vitro cell culture conditions and in vivo after photobleaching. n = 36 cells for in vitro, n = 16 cells for in vivo. (C) Still images from timelapse videos of ZMEL Paxillin-EGFP, revealing Paxillin lifetimes at focal adhesions in vitro and in vivo. Left panel is the whole cell view and the rest of the panels are a magnification of the grey boxes. Red dotted circles mark the same Paxillin-positive punctae from assembly to disassembly. See also Videos 5 and and6.6. (D) Representative graph of Paxillin lifetime curve fitting in which assembly rate, disassembly rate, and lifetime (t1/2) can be calculated. (E–G) Quantification of Paxillin lifetime as t1/2 (E), assembly rate (F), and disassembly rate (G) in the in vitro cell culture conditions and in vivo from ZMEL Paxillin-EGFP timelapse videos. n = 11 cells for both in vitro and in vivo. Error bars are mean ± SD. Non-parametric unpaired t test. Scale bar is 10 µm. |