
- Title
-
Lack of Paxillin phosphorylation promotes single-cell migration in vivo
- Authors
- Xue, Q., Varady, S.R.S., Waddell, T.Q.A., Roman, M.R., Carrington, J., Roh-Johnson, M.
- Source
- Full text @ J. Cell Biol.
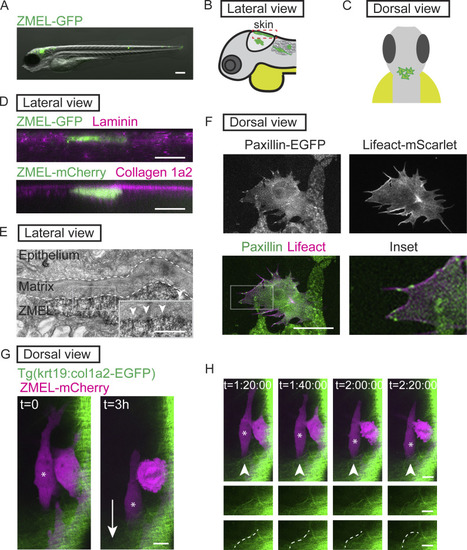
Transplanted ZMEL cells form focal adhesions structures during single-cell migration in vivo. (A) Representative image of ZMEL-GFP whole body dissemination in a 5 dpf (3 d post-transplantation) larval zebrafish. Scale bar is 100 µm. (B and C) Schematic of two imaging views to visualize transplanted ZMEL cells that attach to the zebrafish skin. Lateral view (B); dashed red box indicates skin region; dorsal view (C). (D) Upper panel: Lateral view of a fixed zebrafish larva with transplanted ZMEL-GFP cells (GFP immunostaining, green) in close proximity with laminin (magenta). Lower panel: Lateral view of a live larva with transplanted ZMEL-mCherry cells (pseudocolored in green) that is proximal to collagen labeled with Tg(krt19:col1a2-GFP)zj502 (pseudocolored in magenta). Scale bar is 10 µm. (E) TEM micrograph of a ZMEL cell transplanted in a larval zebrafish (3 d post-transplantation), lateral view. Dashed white lines outline the skin ECM, with a pigmented ZMEL cell underneath the matrix (labeled “ZMEL”). The inset is a magnification of the grey box revealing the ZMEL–matrix interface. Arrowheads mark the electron-dense regions where ZMEL cells contact the matrix. Scale bar is 1 µm. See also Fig. S1 B for non-ZMEL containing control larvae. (F) Live imaging of transplanted ZMEL cells co-expressing zebrafish Paxillin-EGFP (green in overlay and inset) and Lifeact-mScarlet (magenta in overlay and inset) in the zebrafish skin. Inset is the magnified image of the grey box in the overlay. Dorsal imaging view. Scale bar is 10 µm. See also Video 1. (G) Start and end frames from a timelapse video of transplanted ZMEL-mCherry cells (magenta) migrating in the zebrafish skin with collagen (green) labeled with Tg(krt19:col1a2-GFP)zj502. Arrow indicates the direction of migration, and the migrating ZMEL cells are marked with an asterisk. Scale bar is 10 µm. (H) Still images of timelapse video in G. Arrowheads mark a collagen fiber (green) that is buckling as ZMEL cells (magenta, asterisk) migrate. Middle row shows the magnified images of collagen fibers. Bottom row highlights the buckling collagen fiber overlaid with a dashed white line. See also Video 2. |
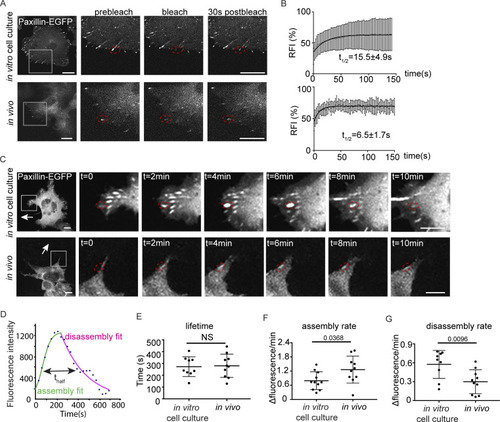
Paxillin exhibits reduced disassembly rates and increased assembly rates at focal adhesions in migrating ZMELs in vivo. (A) Still images of ZMEL Paxillin-EGFP FRAP experiments in vitro and in vivo. Left panel is the whole cell view and the rest of the panels are a magnification of the grey boxes prebleach, upon photobleaching, and 30 s after photobleaching. Red dotted circles mark Paxillin positive punctae that underwent photobleaching. See also Videos 3 and and4.4. (B) Cumulative FRAP recovery curves of Paxillin-EGFP in ZMEL cells in the in vitro cell culture conditions and in vivo after photobleaching. n = 36 cells for in vitro, n = 16 cells for in vivo. (C) Still images from timelapse videos of ZMEL Paxillin-EGFP, revealing Paxillin lifetimes at focal adhesions in vitro and in vivo. Left panel is the whole cell view and the rest of the panels are a magnification of the grey boxes. Red dotted circles mark the same Paxillin-positive punctae from assembly to disassembly. See also Videos 5 and and6.6. (D) Representative graph of Paxillin lifetime curve fitting in which assembly rate, disassembly rate, and lifetime (t1/2) can be calculated. (E–G) Quantification of Paxillin lifetime as t1/2 (E), assembly rate (F), and disassembly rate (G) in the in vitro cell culture conditions and in vivo from ZMEL Paxillin-EGFP timelapse videos. n = 11 cells for both in vitro and in vivo. Error bars are mean ± SD. Non-parametric unpaired t test. Scale bar is 10 µm. |
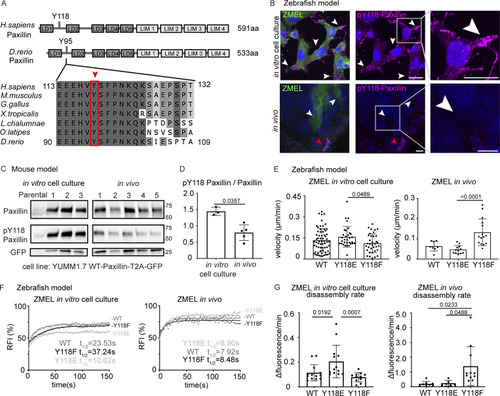
Paxillin exhibits reduced phosphorylation on Y118 in migrating cancer cells in vivo as compared to in vitro cell culture conditions in both zebrafish and mouse melanoma models. (A) Schematic of protein structures of human and zebrafish Paxillin (top) and amino acid sequence comparisons of the region encompassing Y118 between zebrafish Paxillin and vertebrate Paxillin (bottom). Red arrowhead and box indicate the conservation of Y118 Paxillin between zebrafish and other vertebrates. (B) Top: Endogenous pY118-Paxillin staining (magenta) of ZMEL-GFP (GFP immunostaining, green) plated on 2D in vitro cell culture dishes. White arrowheads mark positive pY118-Paxillin staining. Bottom: Endogenous pY118-Paxillin staining (magenta) of ZMEL-mCherry (mCherry immunostaining, pseudo-colored green, white arrowheads) in larval zebrafish (3 d post-transplantation). Red arrowhead indicates a non-ZMEL cell with positive pY118-Paxillin immunostaining. Zoomed regions reveal pY118-Paxillin immunostaining only. Scale bar is 10 µm. (C) Western blot analysis of mouse melanoma YUMM1.7 cells expressing mammalian WT-Paxillin-T2A-GFP plated on the in vitro cell culture dishes (n = 3 dishes) and YUMM1.7 melanoma in vivo tumors (n = 5 tumors). In vitro and in vivo bands are from the same blot—see unmodified Western blot in Fig. S2 D. GFP was used as the loading control and a control for the number of YUMM1.7 cells in mouse tumors. (D) Quantification of pY118-Paxillin/total Paxillin protein ratio from C. Non-parametric unpaired t-test. (E) Quantification of single cell migration velocity in ZMEL-mCherry cells that exogenously express GFP-tagged zebrafish WT-Paxillin, Y118E-Paxillin, or Y118F-Paxillin in the in vitro cell culture conditions (n = 64 cells for WT, n = 32 cells for Y118E, and n = 35 cells for Y118F) and in vivo (n = 8 cells/3 fish for WT, n = 12 cells/3 fish for Y118E, and n = 15 cells/3 fish for Y118F). Larval zebrafish are imaged 1 d post-transplantation. Non-parametric one-way ANOVA, error bars are mean ± SD. (F) Cumulative FRAP recovery curves of WT-Paxillin-EGFP, Y118E-Paxillin-EGFP, or Y118F-Paxillin-EGFP in ZMEL cells in the in vitro cell culture conditions and in vivo after photobleaching. n = 34, 44, and 51 cells for WT, Y118E, Y118F in vitro, and n = 7 cells/6 fish, 6 cells/6 fish, and 6 cells/5 fish for WT, Y118E, Y118F in vivo. (G) Quantification of Paxillin disassembly rates in the WT, Y118E, Y118F-Paxilllin under in vitro cell culture conditions and WT, Y118E, Y118F-Paxilllin under in vivo conditions. n = 13, 13, and 11 cells for WT, Y118E, Y118F in vitro, and n = 8 cells/7 fish, 6 cells/6 fish, 11 cells/10 fish for WT, Y118E, Y118F in vivo. Error bars are mean ± SD. Non-parametric unpaired t test. Source data are available for this figure: SourceData F3. |
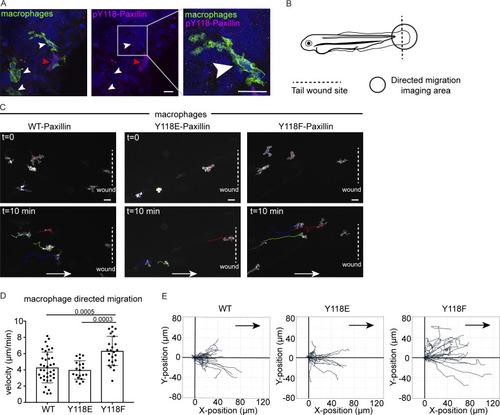
Macrophages expressing non-phosphorylatable Y118F-Paxillin exhibit increased motility in vivo. (A) Endogenous pY118 Paxillin immunostaining (magenta) of macrophages (green, white arrowheads) in Tg(mpeg:Lifeact-GFP)zj506 larval zebrafish. Red arrowhead marks positive pY118 Paxillin immunostaining of a non-macrophage cell. Zoomed region of macrophage lacking pY118-Paxillin immunostaining. (B) Schematic of zebrafish tail wound transection area and macrophage imaging area for directed cell migration. (C) Still images from zebrafish macrophage tracking timelapse videos in 3 dpf Tg(mpeg:WT-zebrafish Paxillin- EGFP)zj503, Tg(mpeg:zebrafish Y118E-Paxillin- EGFP)zj504, and Tg(mpeg:zebrafish Y118F-Paxillin- EGFP)zj505 larvae at timepoint 0 and 10 min. Dotted lines indicate wound sites and arrows show the direction of migration. See also Video 7. Scale bar is 10 µm. (D) Quantification of macrophage migration velocities toward the wound in vivo. Non-parametric one-way ANOVA, error bars are mean ± SD. n = 38 cells/6 fish for WT, n = 20 cells/6 fish for Y118E and n = 24 cells/10 fish for Y118F. (E) Cell tracking of macrophage migration trajectories toward the wound in vivo, migration starting points are normalized to 0 in both x and y axes, wound sites are normalized to the positive x axis (n = 38 cells/6 fish for WT, n = 20 cells/6 fish for Y118E and n = 24 cells/10 fish for Y118F). Arrows show the direction of migration toward the wound. |
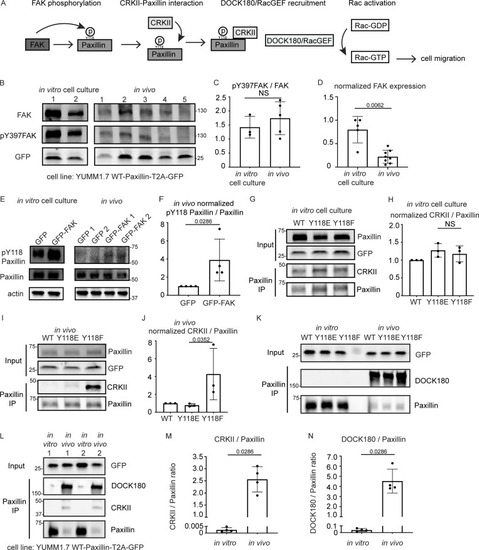
FAK is downregulated and CRKII-DOCK180/RacGEF exhibits increased interaction with unphosphorylated Y118-Paxillin in vivo compared to in vitro. (A) Schematic of in vitro Paxillin regulation from cell culture studies. Following integrin activation, a tyrosine kinase, FAK, phosphorylates Paxillin. Phosphorylated Paxillin then recruits the adaptor protein CRKII and the Paxillin/CRKII complex further recruits DOCK180/RacGEF, thereby activating downstream Rac-dependent pathways, inducing cell migration. (B) Western blot analysis of FAK levels (FAK) and FAK activation (pY397-FAK) in YUMM1.7 cells expressing mammalian WT-Paxillin-T2A-GFP in culture and YUMM1.7 tumors in vivo. In vitro and in vivo bands are from the same blot. Unmodified Western blot is in Fig. S5 A. GFP was used as the loading control and as a control for the number of YUMM1.7 cells in mouse tumors. (C and D) Quantification of the pY397-FAK/total FAK ratio (C) and total normalized FAK to GFP expression (D) in the in vitro cell culture and in vivo conditions. n = 3 dishes, 5 tumors for C, n = 5 dishes, 8 tumors for D. Error bars are mean ± SD. Non-parametric unpaired t test. (E) Western blot analysis of pY118-Paxillin levels in YUMM1.7 cells overexpressing GFP-FAK in vitro and in vivo. Actin is used as a loading control. (F) Quantification of pY118-Paxillin/Paxillin levels in E. GFP control tumors are normalized to 1. n = 4 technical replicates. Error bars are mean ± SD. Non-parametric unpaired t test. (G–J) Co-immunoprecipitation analyses of CRKII and Paxillin in YUMM1.7 cell lines that exogenously express mammalian wildtype, Y118E and Y118F Paxillin in vitro (G and H) and in in vivo tumors (I and J). (H and J) Quantification of CRKII/Paxillin ratio from G and I, bands from cells expressing wildtype Paxillin are normalized to 1 both in vitro and in vivo. n = 3 technical replicates. Non-parametric one-way ANOVA, error bars are mean ± SD. (K) Coimmunoprecipitation analyses of DOCK180/RacGEF and Paxillin in YUMM1.7 cell lines that exogenously express mammalian wildtype, Y118E and Y118F Paxillin in vitro and in in vivo tumors. (L–N) Coimmunoprecipitation analyses of CRKII and DOCK180/RacGEF to Paxillin in YUMM1.7 cell lines that exogenously express wildtype Paxillin in in vitro and in in vivo tumors. (M) Quantification of CRKII/Paxillin levels in L. n = 4 tumors. (N) Quantification of DOCK180/Paxillin levels in L. n = 4 tumors. Error bars are mean ± SD. Non-parametric unpaired t test. Source data are available for this figure: SourceData F5. |
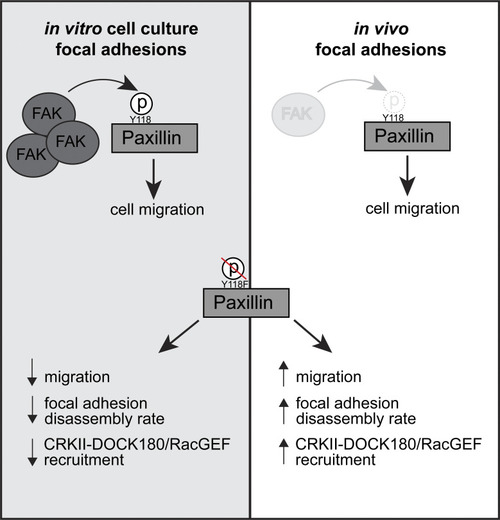
Working model for how Y118-Paxillin phosphorylation status regulates cell migration in the in vitro cell culture and in vivo conditions. Top: Under in vitro cell culture conditions, FAK phosphorylates Paxillin on Y118, leading to high levels of Y118-Paxillin phosphorylation in migrating cells. In migrating cells in vivo, FAK levels are low, and Y118-Paxillin lacks phosphorylation. Bottom: Expression of the non-phosphorylatable Y118F-Paxillin leads to reduced cell migration in vitro compared with cells expressing the Y118E-Paxillin phosphomimetic, likely through reduced focal adhesion disassembly rates and reduced CRKII-DOCK180/RacGEF recruitment to Paxillin-positive focal adhesions. However, in vivo, cells expressing the non-phosphorylatable Y118F-Paxillin exhibit increased cell migration, likely through increased focal adhesion disassembly rates, and increased recruitment of CRKII-DOCK180/RacGEF to Paxillin-positive focal adhesions. |