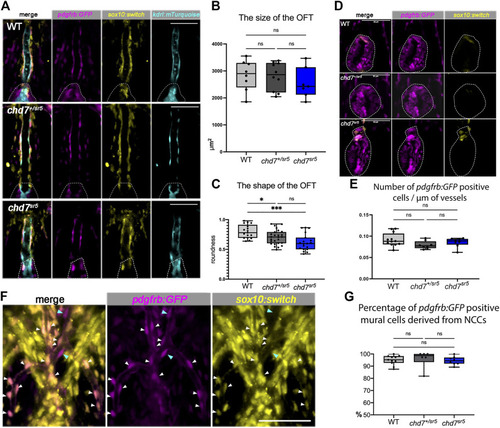
FIGURE 5
- ID
- ZDB-FIG-221227-5
- Publication
- Sun et al., 2022 - Craniofacial and cardiac defects in chd7 zebrafish mutants mimic CHARGE syndrome
- Other Figures
- All Figure Page
- Back to All Figure Page
|
Cardiac NCCs and mural cells are not affected in the VA and OFT of chd7 sr5 mutants at 7 dpf. (A) sox10:switch (pseudo-colored yellow) positive NCCs contribute to pdgfrb:GFP (pseudo-colored magenta) positive mural cells around the VA in WT, chd7 +/sr5 , and chd7 sr5 fish. 40X single-slice confocal images at the thickest z position of the VA. Dotted lines circled the OFT. (B) Quantification of the size of the OFT in WT, chd7 +/sr5 , and chd7 sr5 fish. (WT: n = 8, chd7 +/sr5 : n = 10, and chd7 sr5 : n = 7). (C) Roundness analysis of the shape of OFT in WT, chd7 +/sr5 , and chd7 sr5 fish. (WT: n = 17, chd7 +/sr5 : n = 26, chd7 sr5 : n = 19). (D) Very few sox10:switch-labeled NCCs contribute to the OFT (circled by the dotted lines). 40X single-slide confocal images at the widest z position of the OFT. (E) Quantification of the distribution of the pdgfrb:GFP-positive cells along the vessel. The distribution is determined using the total length of the vessel divided by the total pdgfrb:GFP-positive cells. (WT: n = 12, chd7 +/sr5 : n = 8; chd7 sr5 : n = 8). (F) Representative images of the pdgfrb:GFP and sox10:switch-positive cells along the aortic arches. White arrowheads indicate NCC-derived (sox10:switch) pdgfrb:GFP-labeled mural cells; blue arrowheads indicate the pdgfrb:GFP single positive mural cells. 40X confocal stacked images, stack number n = 2, interval = 6 µm. (G) Quantification of the percentage of pdgfrb: GFP positive mural cells derived from NCCs (sox10: switch positive) along the AAs. Scale bar = 50 µm for all images. The statistical analysis was performed using the ordinary one-way ANOVA test for all data quantifications. (WT: n = 11, chd7 +/sr5 : n = 6; chd7 sr5 : n = 8). ns: p ≥ 0.05, *: p < 0.05, **: p < 0.01, ***: p < 0.001, and ****: p < 0.0001. |
| Fish: | |
|---|---|
| Observed In: | |
| Stage: | Days 7-13 |

