
Fig. 3
- ID
- ZDB-FIG-221030-47
- Publication
- Zheng et al., 2021 - Molecular basis for bipartite recognition of histone H3 by the PZP domain of PHF14
- Other Figures
- All Figure Page
- Back to All Figure Page
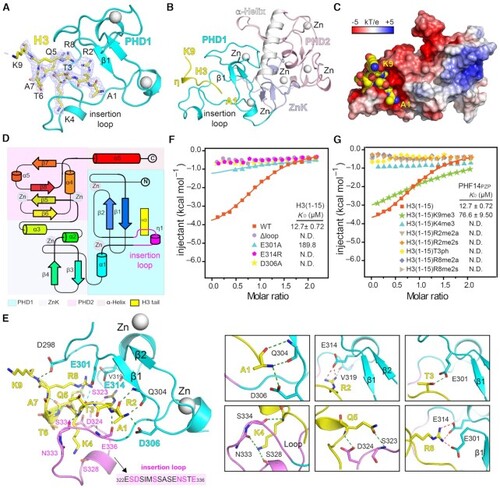
Molecular details for H3(1–9) readout by PHF14PZP. (A) 2Fo−Fc omit map (blue meshes) around the H3 peptide (yellow sticks) is contoured at the 0.7σ level. PHD1 finger is shown as cyan ribbon. (B) Overall structure of the H3(1–25)-PHF14PZP complex. PHD1 finger (cyan), ZnK (light blue), PHD2 finger (light pink), and H3 peptide (yellow) are shown as ribbons. Zinc ions are depicted as white spheres. (C) Electrostatic surface view of PHF14PZP bound to H3 peptides. Electrostatic potential is shown as a spectrum ranging from − 5 kT/e (red) to + 5 kT/e (blue). (D) Topology diagram of the H3(1–9)-PHF14PZP complex. Helices and strands are labelled and rainbow-colored from the N- (blue) to C- (red) termini. H3 is depicted in yellow and the insertion loop is highlighted in magenta. (E) Binding details of PHF14PZP with H3 peptide. The PHD1 finger of PHF14PZP is shown as a cyan and magenta (loop) ribbon. The residues of H3 peptide are depicted as yellow sticks. Key residues of PHF14PZP are depicted as purple or cyan sticks. Green dashes and red dashes represent the hydrogen bonds and ionic bonds, respectively. (F) ITC fitting curves of PHF14PZP mutants titrated with the H3(1–15) peptide. N.D. = not detected. (G) ITC fitting curves of PHF14PZP titrated with the H3(1–15) peptide bearing different modifications. N.D. = not detected. |