
Fig. 4
- ID
- ZDB-FIG-220812-20
- Publication
- D'Agostino et al., 2022 - Loss of circadian rhythmicity in bdnf knockout zebrafish larvae
- Other Figures
- All Figure Page
- Back to All Figure Page
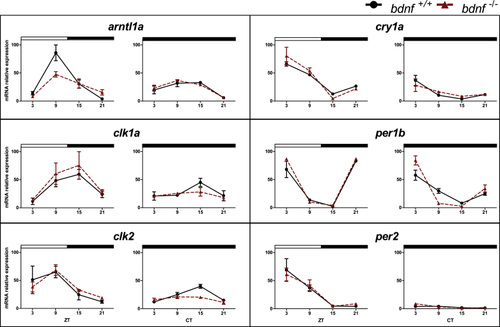
Daily and circadian expression levels of clock genes in zebrafish larvae qPCR analysis of clock and light-regulated clock gene expression at eight dpf in zebrafish larvae exposed to LD cycles and DD. For all panels, each point represents the mean ± SEM (n = 5). Relative expression levels (100% is the maximum level detected for each gene in LD and DD condition) are plotted on the y axis, whereas on the x axes, time is expressed as zeitgeber time (ZT, where ZT0 represents lights on; CT, where CT0 represents beginning of the subjective day). White and black bars represent light and dark periods, respectively. Solid lines indicate bdnf+/+; dotted lines indicate bdnf−/−. |
| Genes: | |
|---|---|
| Fish: | |
| Condition: | |
| Anatomical Term: | |
| Stage: | Days 7-13 |
| Fish: | |
|---|---|
| Observed In: | |
| Stage: | Days 7-13 |