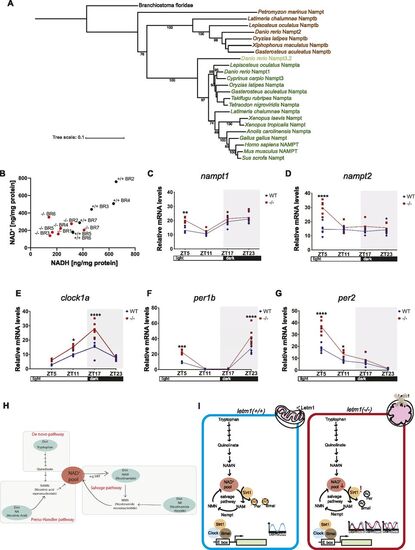
Evolutionary tree of Nampt, measurement of NAD+/H levels, and expression of nampt and clock genes. (A) Phylogenetic analysis of Nampt protein. (B) Measurement of NAD+ and NADH in 1 day post fertilization (dpf) zebrafish embryos WT and letm1−/−. Each data point represents a biological replicate, each biological replicate contained 20 embryos. N(WT) = 6 and n(letm1−/−) = 7 biological replicates, NAD+ P = 0.0789, NADH *P < 0.05, Holm multiple comparison. (C, D) Relative mRNA levels across circadian time points of nampt1 and nampt2 in 6 dpf zebrafish larvae WT (blue) and letm1−/− (red). The expression is normalized to β-actin. Each data point represents a biological replicate, n = 6 biological replicates. One-way ANOVA with Tukey’s multiple comparisons test: ****P < 0.0001. (E, F, G) Relative mRNA levels of clock1a (E), period1b (per1b) (F), and period2 (per2) (G) normalized to β-actin in 6 dpf larvae. Each data point represents a biological replicate, n = 6. One-way ANOVA with Tukey’s multiple comparisons test: *P < 0.05; ***P < 0.001 ****P < 0.0001. (H) Schematic summarizing the NAD+ production pathways in the cell, adapted from Verdin (2015). (I) Schematic of a proposed model linking the effect seen on the circadian clock, based on Sassone-Corsi (2012) and Levine et al (2020).
|

