
FIGURE
Fig. S3
Fig. S3
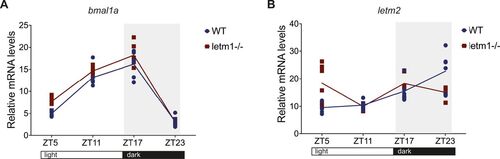
Analyses of bmal1 and letm2 mRNA in letm1+/+ versus letm1−/− compensators. (A, B) Relative mRNA levels of bmal1a (A) and letm2 (B) in 6 day post fertilization larvae normalized to β-actin. Each data point represents a biological replicate, n = 6. One-way ANOVA with Tukey’s multiple comparisons test. |
Expression Data
Expression Detail
Antibody Labeling
Phenotype Data
Phenotype Detail
Acknowledgments
This image is the copyrighted work of the attributed author or publisher, and
ZFIN has permission only to display this image to its users.
Additional permissions should be obtained from the applicable author or publisher of the image.
Full text @ Life Sci Alliance