
FIGURE
Fig. 5
- ID
- ZDB-FIG-220615-52
- Publication
- Sugasawa et al., 2022 - Gene Expression Profile Provides Novel Insights of Fasting-Refeeding Response in Zebrafish Skeletal Muscle
- Other Figures
- All Figure Page
- Back to All Figure Page
Fig. 5
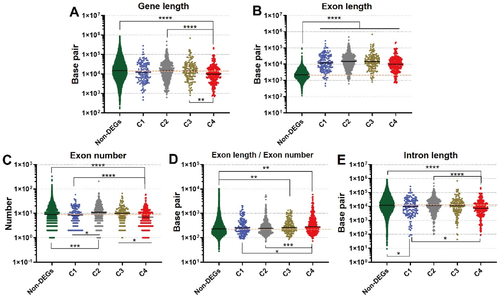
Figure 5. Analysis of gene length, exon length, and exon number in response to refeeding. The graphs show gene length (A), exon length (B), exon number (C), exon length/exon number (D), and intron length (E). The bar indicates the average mean and the orange dashed line shows the average mean of the non-DEGs. * p < 0.05, ** p < 0.01, *** p < 0.001, **** p < 0.0001, respectively.
|
Expression Data
Expression Detail
Antibody Labeling
Phenotype Data
Phenotype Detail
Acknowledgments
This image is the copyrighted work of the attributed author or publisher, and
ZFIN has permission only to display this image to its users.
Additional permissions should be obtained from the applicable author or publisher of the image.
Full text @ Nutrients