
FIGURE
Fig. 3
- ID
- ZDB-FIG-220615-50
- Publication
- Sugasawa et al., 2022 - Gene Expression Profile Provides Novel Insights of Fasting-Refeeding Response in Zebrafish Skeletal Muscle
- Other Figures
- All Figure Page
- Back to All Figure Page
Fig. 3
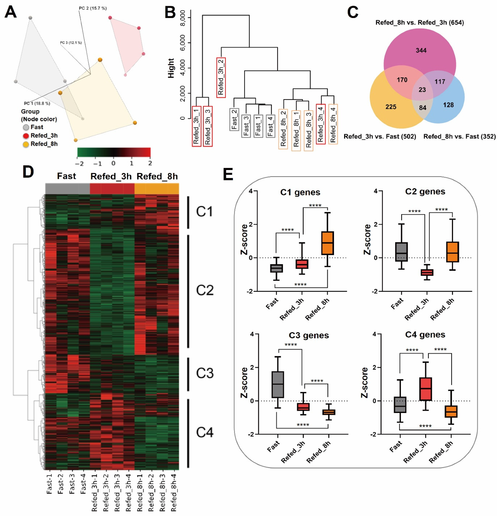
Figure 3. Enrichment analysis in KEGG pathway for gene clusters with confirmed expression values of individual samples. (A) Bar plots represent the analysis of significantly enriched pathways in each cluster. (B) Individual samples with TPM values of genes: trim63a, fbxo32, fbxo25, and cdkn1a. The bar indicates average mean. (C) Individual samples with TPM values of genes: myog, myod1, and slx1b. The bar indicates average mean.
|
Expression Data
Expression Detail
Antibody Labeling
Phenotype Data
Phenotype Detail
Acknowledgments
This image is the copyrighted work of the attributed author or publisher, and
ZFIN has permission only to display this image to its users.
Additional permissions should be obtained from the applicable author or publisher of the image.
Full text @ Nutrients