
FIGURE
Fig. 2
- ID
- ZDB-FIG-220615-49
- Publication
- Sugasawa et al., 2022 - Gene Expression Profile Provides Novel Insights of Fasting-Refeeding Response in Zebrafish Skeletal Muscle
- Other Figures
- All Figure Page
- Back to All Figure Page
Fig. 2
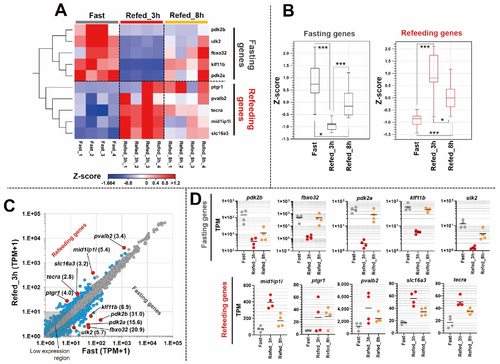
Figure 2. Gene expression profile of muscle tissues during fasting-refeeding conditions in zebrafish. (A) PCA plot and (B) cluster dendrogram depict similarities between samples. (C) Venn diagram shows the number of DEGs between three groups (Refed_8h vs. Refed_3h, Refed_3h vs. Fast, and Refed_8h vs. Fast). (D) Heat map represents expression of the 1091 DEGs. Values in the rows are z-scores. (E) Box plot shows expression patterns in each cluster on the heat map. The box indicates the first to the third quartile and the line indicates the median. The whiskers show the box with 5–95 percentile. **** p < 0.0001.
|
Expression Data
Expression Detail
Antibody Labeling
Phenotype Data
Phenotype Detail
Acknowledgments
This image is the copyrighted work of the attributed author or publisher, and
ZFIN has permission only to display this image to its users.
Additional permissions should be obtained from the applicable author or publisher of the image.
Full text @ Nutrients