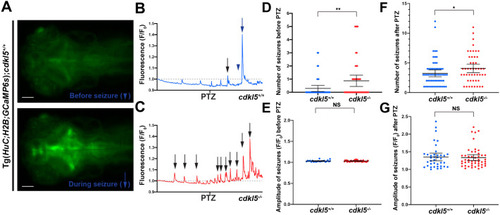
Analysis of seizures in cdkl5−/− fish. (A) Images of the brain region in Tg(HuC:H2B-GCaMP6s); cdkl5+/+ fish before (indicated in B by the blue arrowhead) and during a seizure (indicated in B by the blue arrow) at 6 dpf. Scale bars: 100 µm. (B,C) Representative time trace images of fluorescence (F/F0,) in control conditions and after the addition of 20 mM PTZ (at the time indicated) for Tg(HuC:H2B-GCaMP6s);cdkl5+/+ (B) and Tg(HuC:H2B-GCaMP6s);cdkl5−/− (C) fish. The fluorescence data are integrated over the whole embryonic brain. Seizures (arrows) are represented by peaks in fluorescence that extend above the baseline level (represented by the dotted line). (D,E) Quantification of the number (D) and amplitude (E) of seizures observed before PTZ treatment in Tg(HuC:H2B-GCaMP6s);cdkl5+/+ and Tg(HuC:H2B-GCaMP6s);cdkl5−/− fish. (F,G) Quantification of the number (F) and amplitude (G) of seizures observed after PTZ treatment in Tg(HuC:H2B-GCaMP6s);cdkl5+/+ and Tg(HuC:H2B-GCaMP6s);cdkl5−/− fish. Data are mean±95% c.i. for three independent experiments [n=9, 12 and 18 for Tg(HuC:H2B-GCaMP6s);cdkl5+/+, and n=19, 13 and 16 for Tg(HuC:H2B-GCaMP6s);cdkl5−/− fish]. *P<0.05; **P<0.01; NS, not significant (two-tailed t-test).
|
