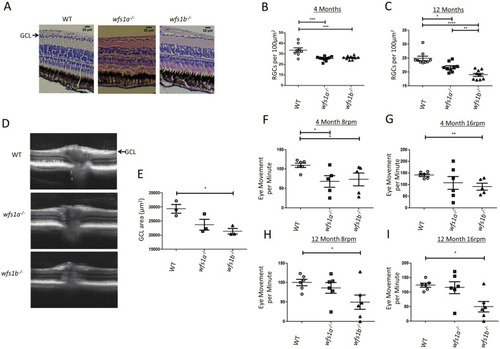
Retinal ganglion cell count and visual function in wfs1a−/− and wfs1b−/− zebrafish. (A) Representative images of WT, wfs1a−/− and wfs1b−/− retinal sections at 4 months of age (scale bar = 20 µm). For RGC counts, 6 boxes of the same area (100 μm2) were used with 3 boxes on either side of the optic nerve. The number of RGC cell bodies were counted and averaged. (B) RGC count per 100 μm2 at 4 months of age (WT n = 8; wfs1a−/− n = 10; wfs1b−/− n = 9). (C) RGC count per 100 μm2 at 12 months of age (WT n = 10; wfs1a−/− n = 9; wfs1b−/− n = 9). Data plots represent mean ± SEM. Statistical significance was calculated using the Kruskal–Wallis test (One-way ANOVA on ranks). (D) Optical coherence tomography (OCT) images of retinal cross-sections from 12-month-old zebrafish showing significant thinning of the ganglion cell layer (GCL) in wfs1a−/− and wfs1b−/− zebrafish (arrow). (E) Measurement of GCL area (WT mean = 29,393 ± 2653 μm2; wfs1a−/− mean = 23,688 ± 3332 μm2; wfs1b−/− mean = 21,363 ± 1,737 μm2; n = 3 for all 3 groups). Data plots represent mean ± SEM. Statistical significance was calculated using One-way ANOVA with Bonferroni’s multiple comparison tests. (F–I) Optokinetic response (OKR) of 4- and 12-month-old fish tested at 8 rpm and 16 rpm. Videos were recorded of fish eye tracking and the movements were manually counted (Supplementary video 3). Data plots represent mean ± SEM. Statistical significance was calculated using One-way ANOVA with Bonferroni’s multiple comparison tests. *p < 0.05; **p < 0.01; ***p < 0.005; ****p < 0.001; rpm: revolutions per minute.
|

