
FIGURE
Fig. 3
- ID
- ZDB-FIG-210329-25
- Publication
- Behrens et al., 2020 - At the root of T2R gene evolution: Recognition profiles of coelacanth and zebrafish bitter receptors
- Other Figures
- All Figure Page
- Back to All Figure Page
Fig. 3
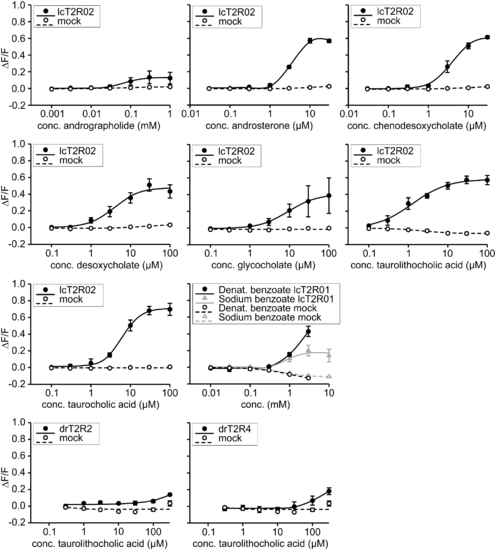
Dose–response curves of selected agonist-receptor pairs. The cDNA constructs of the bitter taste receptors of coelacanth (lcT2R#) and zebrafish (drT2R#) were transiently transfected into HEK 293T-Gα16gust44 cells and subsequently subjected to calcium mobilization assays using an automated fluorometric imaging plate reader (FLIPRtetra). Cells transfected with an empty expression vector served as negative controls (mock). The relative changes in fluorescence (ΔF/F) are plotted on the y axis (means ± SD, n = 4), the applied compound concentrations on the logarithmically scaled x axis. |
Expression Data
Expression Detail
Antibody Labeling
Phenotype Data
Phenotype Detail
Acknowledgments
This image is the copyrighted work of the attributed author or publisher, and
ZFIN has permission only to display this image to its users.
Additional permissions should be obtained from the applicable author or publisher of the image.
Full text @ Genome Biol. Evol.