
FIGURE
Fig. 5
- ID
- ZDB-FIG-210329-27
- Publication
- Behrens et al., 2020 - At the root of T2R gene evolution: Recognition profiles of coelacanth and zebrafish bitter receptors
- Other Figures
- All Figure Page
- Back to All Figure Page
Fig. 5
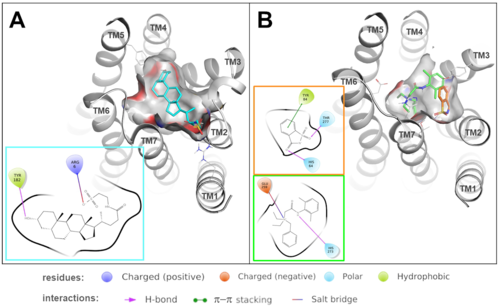
Predicted binding modes of ligands in lcT2R01 and drT2R3a. Predicted binding modes of taurolithocholic acid (colored in cyan) into lcT2R02 (A) and of denatonium (colored in green) and saccharine (colored in orange) into drT2R3a (B). 3D representations show how the ligand is accommodated in the binding site, ligand–receptor interactions (including π–π stacking interactions, salt bridges and hydrogen bonds) are detailed in the 2D diagrams. |
Expression Data
Expression Detail
Antibody Labeling
Phenotype Data
Phenotype Detail
Acknowledgments
This image is the copyrighted work of the attributed author or publisher, and
ZFIN has permission only to display this image to its users.
Additional permissions should be obtained from the applicable author or publisher of the image.
Full text @ Genome Biol. Evol.