
Fig. 2
- ID
- ZDB-FIG-210329-24
- Publication
- Behrens et al., 2020 - At the root of T2R gene evolution: Recognition profiles of coelacanth and zebrafish bitter receptors
- Other Figures
- All Figure Page
- Back to All Figure Page
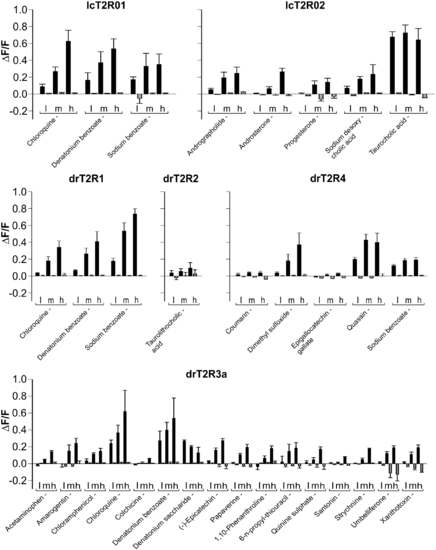
Activation profiles of coelacanth and zebrafish bitter taste receptors. The cDNA constructs of the bitter taste receptors of coelacanth (lcT2R#) and zebrafish (drT2R#) were transiently transfected into HEK 293T-Gα16gust44 cells and subsequently subjected to calcium mobilization assays using an automated fluorometric imaging plate reader (FLIPRtetra). Bitter substances that were considered as potential activators during the first round of screening were applied in three different concentrations (low [l], medium [m], high [h]; the high concentration corresponds to the maximal concentration given in supplementary table S1, Supplementary Material online, medium and low concentrations represent each 3-fold dilution steps of test compounds) to the corresponding receptor transfected cells and the changes in fluorescence (y axis, ΔF/F) were monitored (means ± SD, n = 4). Only compound-receptor pairs resulting in statistically significant (Student’s t-test, P ≤ 0.05) fluorescence changes in transfected cells with at least one of the tested concentrations were judged positive. The receptors and the corresponding identified agonists are indicated. |