|
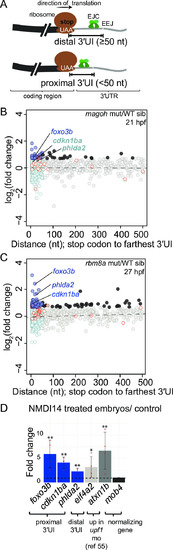
Transcripts encoded by genes with a proximal 3′UTR intron are upregulated in EJC mutant and in NMDI14-treated embryos.A. Top: Schematic illustrating genes with 3′UTR introns (3′UI) where the distance between the stop codon and the 3′UI is equal to or greater than 50 nts. Such 3′UI are classified as distal. Bottom: Schematic illustrating genes with 3′UI where the distance between the stop codon and 3′UI is less than 50 nts. Such 3′UI are classified as proximal. The ribosome (brown), direction of translation (black arrow), stop codon (‘UAA’ in white), EJC (green), exon-exon junction (EEJ), coding region of mRNA (black) and 3′UI of mRNA (gray) are labeled in the top panel. B. A scatter plot showing gene-level fold change (FC) for transcripts with proximal 3′UI (dark blue: FC > 1.5 and light blue: FC < 1.5) and distal 3′UI (black: FC > 1.5 and gray: FC < 1.5) in magoh mutant embryos at 21 hpf compared to wild-type siblings. Dots encircled in red represent genes that also contain an upstream open reading frame (see methods). Genes labelled on the plot also contain a proximal 3′UI in mouse and human, and are upregulated in both rbm8a mutant datasets (Fig 6C and S4C Fig) and the upf1 KD dataset (S4D Fig). These genes were independently validated in (D). C. A scatter plot as in B showing fold changes for rbm8a mutant embryos at 27 hpf compared to wild-type siblings. D. qRT-PCR analysis showing fold changes for proximal 3′UI-containing genes (blue bars), a distal 3′UI-containing gene (light gray bar), and a Upf1-regulated gene ([55], dark gray bar) compared to the control gene (black bar) in zebrafish embryos treated with NMDI14 from 3–24 hpf. Red dots: the value of each individual replicate. Error bars: standard error of means. Horizontal black dotted line: fold change = 1. Welch’s t-test p-values (** p-value < 0.05; * p-value < 0.1).
|