|
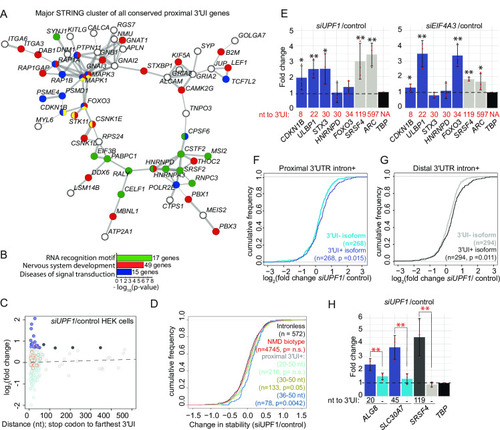
Proximal position of 3′UTR introns is conserved in many vertebrate genes and a subset of proximal 3′UI-containing genes are NMD-sensitive in human cells.A. A major interaction cluster predicted by STRING network analysis of genes with a 3′UI in proximal position in zebrafish, mouse and human. Nodes are colored by gene/protein function: nervous system (red), presence of RNA recognition motif (RRM) (green), diseases of signal transduction (blue), FoxO signaling pathway (yellow). (167 nodes and 127 edges in total, PPI enrichment p-value = 0.02). B. Gene ontology enrichment analysis of all 167 genes with conserved 3′UI proximal positioning. The most significant GO term within the following functional categories are shown: Interpro domains, Biological process and Reactome pathways. C. A scatter plot showing fold changes for APPRIS-annotated proximal 3′UI transcripts (dark blue: FC > 1.5 and light blue: FC < 1.5) and distal 3′UI transcripts (black: FC > 1.5 and gray: FC < 1.5) in UPF1 knockdown HEK293 cells compared to control cells [57]. Dots encircled in red are transcripts that also contain an uORF as determined previously in [57]. Same analysis for Ensembl transcript annotations is shown in Fig S5G. D. Empirical CDF plot showing change in mRNA stability for different classes of NMD targets and intron-less genes upon UPF1 knockdown in HEK293 cells (data from [57]). The gene classes are as follows: proximal 3′UI-containing genes where distance is 20–50 nts (light green), 30–50 nts (olive green) and 36–50 nts (dark blue), Ensembl-annotated NMD-biotype genes (red) and intron-less genes (black). CDF function is plotted as in Fig 5B. KS test p-value for comparison of NMD targets to intron-less genes is indicated in the same color. E. qRT-PCR analysis showing fold changes for proximal 3′UI-containing genes CDKN1B, FOXO3 (upregulated in zebrafish); ULBP1; STX3 (highest change in stability upon UPF1 KD in HEK293 cells [57]); HNRNPD (encodes RRM-containing protein) and distal 3′UI-containing genes (ARC and SRSF4) upon UPF1 (left) and EIF4A3 (right) knockdown in HCT116 cells. The distance between stop codon and 3′UI for every 3′UI-containing gene is indicated below each bar. TBP is the normalizing gene used for qRT-PCR analysis. Welch’s t-test p-values are indicated using asterisks (** p-value < 0.05 and * p-value < 0.1). F. Empirical CDF plot of fold changes in levels of 3′UI-containing isoforms (dark blue) as compared to 3′UI-lacking isoforms (sky blue) encoded from same genes in UPF1-depleted HEK293 cells. KS test p-value for differences in the two distributions is indicated on the bottom right. G. CDF plot as in F showing the fold changes in levels of distal 3′UI-containing (black) versus 3′UI-lacking isoforms (gray). H. qRT-PCR analysis showing fold changes for 3′UI-containing and 3′UI-lacking isoforms encoded by proximal 3′UI-containing genes ALG8 and SLC30A7 and by a distal 3′UI-containing gene SRSF4 upon UPF1 knockdown in HCT116 cells. The distance of 3′UI when present, or its absence (-) is indicated below each bar. TBP is the normalizing gene used for qRT-PCR analysis. Welch’s t-test p-values for the three biological replicates of each transcript are < 0.05. The Welch’s paired t-test p-values for the comparison between fold changes of 3′UI-containing and 3′UI-lacking isoforms is indicated using red asterisks (** p-value < 0.05).
|