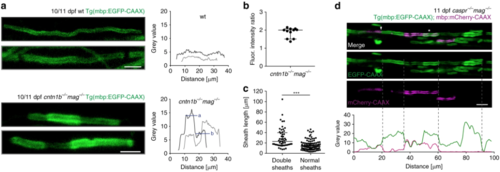
Loss of adhesive molecules results in myelin overgrowth in zebrafish. a Myelin sheaths in 10/11 dpf cntn1b−/−mag−/− fish show fluorescence intensity steps absent in wild-type fish. Fluorescence intensities along example sheaths. ‘a’ and ‘b’ represent mean fluorescence intensity levels. b Fluorescence intensity ratios (calculated ‘a’/’b’ according to panel ( a) in 11 representative cntn1b−/−mag−/− sheaths (n = 4) show two fold increase in fluorescence along the sheath in bright areas as compared to the neighboring regions. Median with interquartile range. c Length of sheaths with fluorescence intensity steps (n = 53 sheaths from 3 fish) vs. evenly labeled sheaths (n = 100 sheaths from 3 fish) in 10 dpf cntn1b−/−mag−/− fish (two-tailed Mann Whitney test, ***p < 0.0001, median with interquartile range). Sheaths were quantified from a more dorsal region compared to Fig. 2. d Expression of mbp:mCherry-CAAX in 11 dpf caspr−/−mag−/− fish reveals double myelin sheaths (asterisk) and loss of nodes of Ranvier (arrowhead). Fluorescence intensity plot along the upper myelinated axon (green = EGFP-CAAX, magenta = mCherry-CAAX). Dotted lines represent corresponding positions in image and plot. Images ( a, d) are maximum intensity projections of Tg(mbp:EGFP-CAAX) zebrafish dorsal spinal cord. Scale bars, 4 μm ( a), 10 μm ( d). Source data are provided as a Source Data file