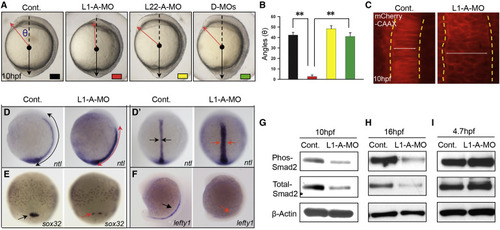
Opposing Roles of RP Paralogs Rpl22 and Like1 in Regulating Gastrulation (A and B) One-cell stage zebrafish embryos were injected with translational-blocking Like1-A-MO (L1-A-MO; 2 ng), L22-A-MO (6 ng), or both (D-MOs), following which effects on gastrulation were assessed. The images of embryos represent lateral views at 10 hpf. The red and black lines indicate the anterior and posterior ends of the body axis, respectively. The angle (θ), which defines the degree of extension, was measured between the red arrow and dashed black line and is represented graphically as the mean ± SD. Control (Cont; black); Like1 MO (L1-A-MO; red); Rpl22 MO (L22-A-MO; yellow); and double-morphants (D-MO; green). Triplicate samples were quantified and the mean ± SD is depicted graphically. ∗∗p < 0.01. (C) Imaging of notochord in Like1 morphants (10 hpf) co-injected with 100 pg mCherry-CAAX mRNA at the one-cell stage. The dorsal view, anterior is at the top. The lateral notochord boundaries are indicated by the dotted yellow lines, and the width of notochord was marked by white lines. (D and D′) Expression patterns of ntl in 10 hpf Like1 morphants. Red arrows mark changes in distribution in the images representing lateral (D) and dorsal (D′) views. (E and F) sox32 and lefty1 expression in Like1 morphants. Red arrows indicate changes in expression or distribution. (E) 75%-epiboly stage, dorsal view. (F) Lateral view, 16 hpf. (G–I) Phospho-Smad2 and total-Smad2 were assessed in 10 hpf (G), 16 hpf (H), and 4.7 hpf (I) Like1 morphants by immunoblotting. All results are representative of at least three experiments performed. See also Figure S1.
|

