
Fig. 1
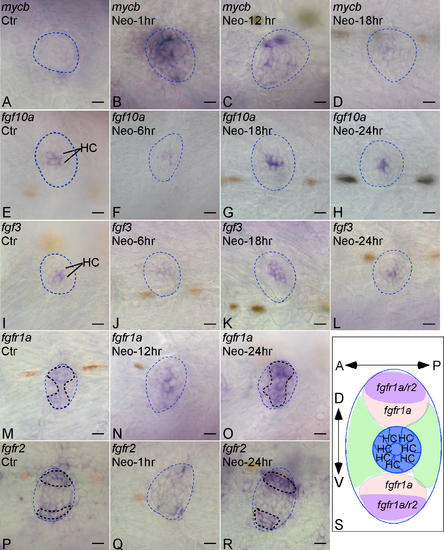
Expression of Myc and Fgf pathway genes during HC regeneration in zebrafish neuromasts by in situ hybridization. mycb (A-D), fgf10a (E-H), fgf3 (I-L), fgfr1a (M-O), fgfr2 (P-R) expression were shown in the lateral line neuromast L1 from 5-dpf zebrafish at different time points following neomycin treatment (e.g. Neomycin-6hr, 6 hrs after neomycin treatment). Ctr, untreated fish larvae. Dotted blue lines marked the boundary of neuromasts. Bold dotted lines marked the expression areas (M,O,P,R). (S) An illustration of a neuromast demarcated by differential fgfr expression patterns, including HC region, fgfr1a(+) only region, fgfr1a/r2(+) region and fgfr1a(-) region. A-P, anterior-posterior; D-V, dorsal-ventral. Scale bars: 10 μm. |
| Genes: | |
|---|---|
| Fish: | |
| Condition: | |
| Anatomical Terms: | |
| Stage Range: | Day 5 to Day 6 |
| Fish: | |
|---|---|
| Condition: | |
| Observed In: | |
| Stage Range: | Day 5 to Day 6 |