
Fig. 5, S3
- ID
- ZDB-FIG-150826-11
- Publication
- Auer et al., 2015 - Deletion of a kinesin I motor unmasks a mechanism of homeostatic branching control by neurotrophin-3
- Other Figures
- All Figure Page
- Back to All Figure Page
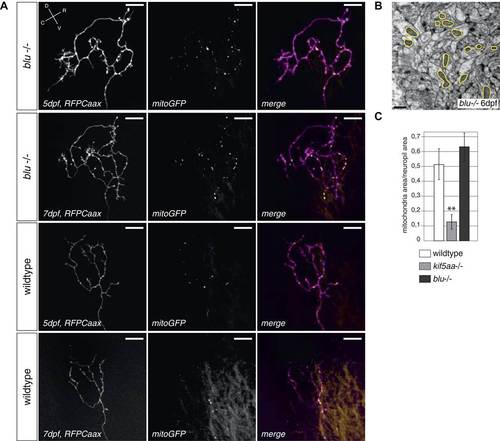
Retinal Ganglion Cells show a normal mitochondria distribution in blumenkohl mutants. (A) Distribution of mitochondria (labeled by mitoGFP) in single blumenkohl mutant and wild-type RGC arbors expressing membrane localized RFP (RFPCaax) in vivo. Upper two panels: blumenkohl mutant cell arbors at 5 and 7 dpf, lower two panels: wild-type cell arbors at 5 and 7 dpf. D = dorsal, V = ventral, R = rostral, C = caudal. Scale bars = 20 µm. (B) Transmission electron micrograph of a transvers section of the blumenkohl mutant neuropil containing RGC axonal arbors. In yellow circles: mitochondria. Scale bar = 500 nm. (C) Quantification of mitochondria area per neuropil area comparing wildtype, blumenkohl and kif5aa mutant tecta at 6 dpf. No difference is observed between wild-type and blumenkohl mutant cells while kif5aa mutants contain significantly less mitochondria than wild-type cells (p < 0.01). The graphs for kif5aa and wild-type cells were taken from Figure 5. |