
Fig. 5, S2
- ID
- ZDB-FIG-150826-10
- Publication
- Auer et al., 2015 - Deletion of a kinesin I motor unmasks a mechanism of homeostatic branching control by neurotrophin-3
- Other Figures
- All Figure Page
- Back to All Figure Page
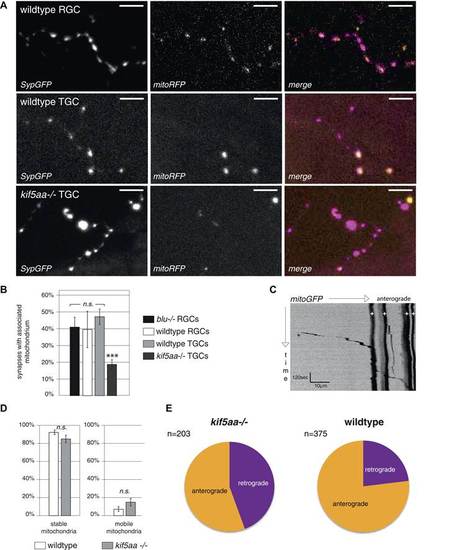
Analysis of mitochondria localization and transport dynamics in wildtype and kif5aa mutant RGC arbors. (A) As previously shown in other experimental systems (Obashi and Okabe, 2013) mitochondria are often localized in close proximity to synapses. In the upper panel, an axonal segment of a single RGC axon with labeled synapses (SypGFP) and mitochondria (mitoRFP) is shown. Scale bar = 5 µm. The middle panel and the lower panel show an axonal segment of a trigeminal Ganglion Cell (TGC) with labeled synapses and mitochondria in wild-type and kif5aa mutant embryos, respectively. Scale bar = 5 µm. (B) In wildtype and blumenkohl mutant embryos about 40% of synapses in RGCs possess an associated mitochondrion (blu RGCs: 41/91, wt RGCs: 68/153). This percentage is also observed in wild-type TGCs while in kif5aa mutant TGCs only about 20% of synapses contain a colocalized mitochondrion (wt TGCs: 117/235, kif5aa TGCs: 99/452). (C) Kymograph of labeled mitochondria within an RGC axonal segment (see Video 4). White crosses = stable mitochondria. Black asterisk = Single mitochondrion moving in anterograde direction. (D) Comparison of mitochondria dynamics between wild-type and kif5aa mutant RGC axons at 5 dpf. In both, most mitochondria are stable while only about 15% of mitochondria are motile. (E) Of these, in mutant cells mitochondria move significantly more often in retrograde direction (p < 0.05). Wild-type cells show a higher proportion of anterograde transport. |