|
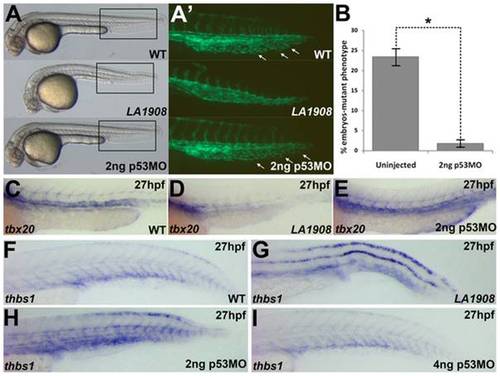
Loss of function of utp15 induces p53 activity. A, Brightfield Phase contrast images of 30 hpf embryos. LA1908 mutant embryos manifest defects in the brain and the vasculature as well as a significantly shorter body when compared to their wild type siblings. Injection of 2 ng p53MO is sufficient to prevent CNS necrosis (A), restore normal CVP morphology (A′), and normalize the gross morphology of the mutant embryos. A′, Magnified image of boxed regions of Tg[kdrl:GFP] embryos in (A). Note normal ISV patterning and presence of EC sprouting within the CVP (white arrows), resulting in a prototypical plexus. B, Chi-squared analysis of WT:Mutant ratios from 3 independently replicated experiments. n = 220 uninjected control embryos, 298 2 ng p53MO-injected embryos, * = p-value<0.001. Data are average +/- SEM. C–E, Analysis of tbx20 expression, a marker of arterial endothelial cells, demonstrated p53MO also restores normal expression levels and patterning (E) which were lost in mutants (D) relative to WT (C) embryos. Embryos are representative of experiments performed in triplicate on a minimum of 5 embryos per condition. F–H, thbs1 is expressed in a p53-dependent manner. Under normal conditions (F), expression is observed in the floor plate, dorsal neural tube, and in the ventral somites/axial vasculature. In mutant embryos, thbs1 expression is substantially upregulated (G). Knockdown of p53 reduced thbs1 expression in a dose-dependent manner. Roughly half (18/41) of the embryos injected with 2 ng p53MO have thbs1 levels as shown in (H), with the remainder (23/41) displaying WT (F) levels. When the dose is increased to 4 ng (I), 82% of embryos (31/38) had WT (F) levels of thbs1 mRNA, while only 18% (7/38) appeared as in (H).
|

