
FIGURE
Fig. 8
Fig. 8
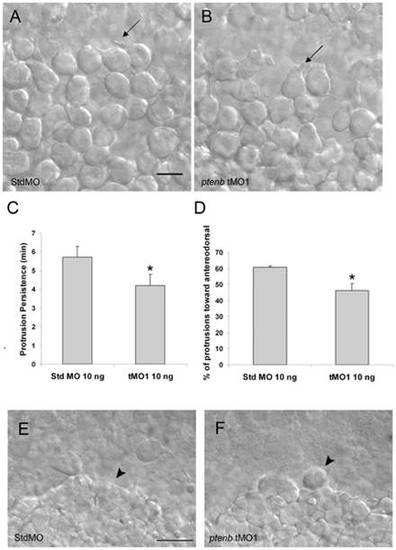
Cell protrusions of lateral hypoblast cells are affected by ptenb MO. Embryos were injected with 10 ng of StdMO (A) or ptenb tMO1 (B), imaged under DIC microscopy and recorded between 75% to 85% epiboly stages. Representative snapshots are shown and arrows are pointing to typical cell protrusions. By examining a 1-h recording, the average persistent time of each protrusion (C) and the percentage of protrusions pointed anterodorsally (D) were calculated and shown for each treatment. * : p<0.05, scale bars: 25 μm. |
Expression Data
Expression Detail
Antibody Labeling
Phenotype Data
| Fish: | |
|---|---|
| Knockdown Reagent: | |
| Observed In: | |
| Stage: | 75%-epiboly |
Phenotype Detail
Acknowledgments
This image is the copyrighted work of the attributed author or publisher, and
ZFIN has permission only to display this image to its users.
Additional permissions should be obtained from the applicable author or publisher of the image.
Full text @ PLoS One