FIGURE
Fig. 2
- ID
- ZDB-FIG-100211-43
- Publication
- Davey et al., 2010 - Differential expression of neuroligin genes in the nervous system of zebrafish
- Other Figures
- All Figure Page
- Back to All Figure Page
Fig. 2
|
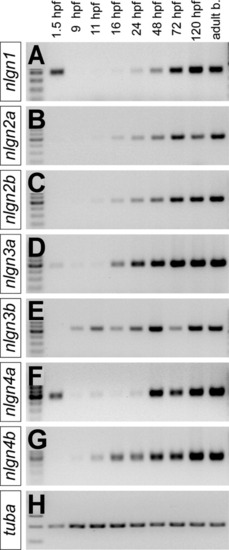
Analysis of nlgn expression levels during development. Expression levels were assayed by RT-PCR using primers specific to (A-G) the zebrafish nlgns across multiple developmental stages and in the adult brain, and (H) tubulin alpha control. From left to right, cDNA samples were derived from wild-type (AB/Tübingen) zebrafish at the 16-cell (1.5 hpf), 90% epiboly (9 hpf), 3-somite (11 hpf), 16-, 24-, 48-, 72-, and 7-dpf stages and from adult brain. |
Expression Data
| Genes: | |
|---|---|
| Fish: | |
| Anatomical Terms: | |
| Stage Range: | 16-cell to Adult |
Expression Detail
Antibody Labeling
Phenotype Data
Phenotype Detail
Acknowledgments
This image is the copyrighted work of the attributed author or publisher, and
ZFIN has permission only to display this image to its users.
Additional permissions should be obtained from the applicable author or publisher of the image.
Full text @ Dev. Dyn.

