
FIGURE
Fig. 3
- ID
- ZDB-FIG-100211-44
- Publication
- Davey et al., 2010 - Differential expression of neuroligin genes in the nervous system of zebrafish
- Other Figures
- All Figure Page
- Back to All Figure Page
Fig. 3
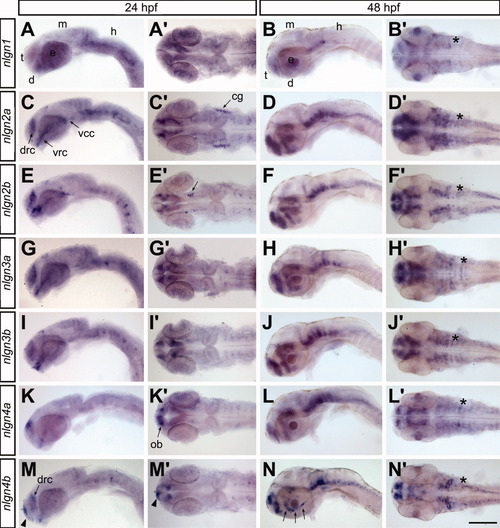
Expression of nlgns in the developing nervous system. The expression patterns for the nlgn genes were revealed by whole-mount ISH and are displayed as lateral views and dorsal views (A-N′) at 24 (A,C,E,G,I,K,M) and 48 hpf (B,D,F,H,J,L,N). d, diencephalon; e, eye; h, hindbrain; m, midbrain; t, telencephalon; cg, cranial ganglia; ob, olfactory bulb; dorso-rostral cluster; vcc, ventro-caudal cluster; vrc, ventro-rostral cluster; asterisks (*) denote the otic vesicles. Scale bar = 110 μm in 24-hpf embryos and 90 μm in 48-hpf embryos. |
Expression Data
| Genes: | |
|---|---|
| Fish: | |
| Anatomical Terms: | |
| Stage Range: | Prim-5 to Long-pec |
Expression Detail
Antibody Labeling
Phenotype Data
Phenotype Detail
Acknowledgments
This image is the copyrighted work of the attributed author or publisher, and
ZFIN has permission only to display this image to its users.
Additional permissions should be obtained from the applicable author or publisher of the image.
Full text @ Dev. Dyn.