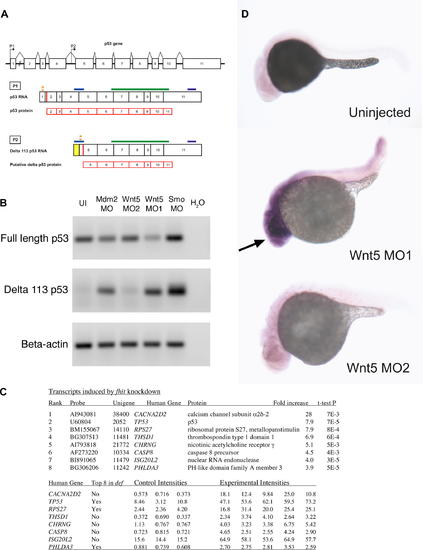
p53 Isoforms Expression in Various MO-Injected Embryos (A) Schematic of p53 and Δ113 p53 transcripts. The p53 gene contains 11 exons (indicated by numbered rectangles), with the two promoters P1 and P2 indicated by the arrows. Transcription initiation at promoter P1 in exon 1 generates the full-length p53 transcript. Δ113 p53 transcript is initiated at an internal promoter in intron 4, P2, and contains the 3′ end of intron 4 (indicated by the yellow rectangle), and likely uses the Met at position 113 as translational start (red bar) [22]. Translation start sites for the two transcripts are indicated by the red bars (in exon 2 for P1; putative translation start in exon 5 for P2, corresponding to Met 113). Translational MO binding sites for the two isoforms are indicated by orange stars. The MO for full-length p53 most likely does not affect the Δ113 p53 transcript, as its binding site is 386 nt upstream of the translational start for the Δ113 p53 transcript. The fragments amplified for the RT-PCR experiments are indicated by the blue bars and are specific to each isoform. The riboprobe fragment for in situ hybridization (indicated by the green bars) and the microarray probe binding site (indicated by the purple bars) are common to both isoforms. (B) RT-PCR for full-length p53 and Δ113 p53. Final products of 30 cycles of RT-PCR for Δ113 p53 were analyzed by gel electrophoresis on a 1% agarose gel, stained with ethidium bromide. β-actin was used as loading control. There is no significant upregulation of full-length p53 expression levels in various morphants. Note the lack of expression of Δ113 p53 in uninjected embryos or morphants with no neural death. Embryos injected with MOs that cause neural death show a significant increase of Δ113 p53 isoform expression. (C) Transcripts induced by fhit knockdown in microarray assays. Fold increases in mRNA accumulation and t-test p values were calculated from the three control (phenol red-injected) intensities and the five experimental intensities determined in eight independent hybridizations using printed 16,399 element 65mer microarrays. The first three experimental samples were embryos injected with the gripNA targeting fhit while the fourth and fifth experimental samples were Fhit morphants. NCBI unigene identifiers are for the D. rerio genes. Gene symbols correspond to human orthologs. The three transcripts common to the top eight induced transcripts in fhit and def [22] datasets are indicated. (D) p53 in situ hybridization. Expression of p53 transcripts is increased in the anterior part of the embryo (indicated by the arrow) upon injection of Wnt5 MO1 (that causes neural death), but not in the morphant with no neural death (Wnt5 MO2).
|

