
- Title
-
Zebrafish raptor mutation inhibits the activity of mTORC1, inducing craniofacial defects due to autophagy-induced neural crest cell death
- Authors
- Tucker, S.K., Gosul, R., Swartz, M.E., Zhang, S., Eberhart, J.K.
- Source
- Full text @ Development

A mutant allele of regulatory-associated protein of mTOR (raptor) generated using CRISPR-Cas9. (A) The raptorau93 mutation is located in exon 7 (black arrowhead), upstream of all 12 known Raptor phosphorylation sites (red dots). (B) Sanger sequencing results for wild-type and raptorau93 alleles. The CRISPR-Cas9 gRNA target is indicated by a bracket. The 4 bp deletion is indicated by the black rectangle. (C) The raptor au93 allele is predicted to have altered amino acid sequence beginning at residue 231, with a predicted premature termination codon at residue 238 (red, asterisk). The CRISPR-Cas9 gRNA target is indicated by a bracket and the four deleted nucleotides are in bold and red. |

Validation of the raptor mutant allele. (A) RT-qPCR primer design. Forward primer (green line) amplifying both alleles is upstream of the mutation site. Wild-type allele forward primer (broken green line) contains the nucleotides deleted in the mutant (red); the mutant allele forward primer (green line) matches the deletion. Reverse primer (red line) is in the subsequent exon (exon 8). (B) RT-qPCR using primer pairs that amplify both alleles, the wild-type (WT) allele or the mutant (Mut) allele. cDNA from 4 dpf wild-type fish (circles), 4 dpf heterozygous fish (triangles) or 4 dpf raptor mutant fish (squares) was used. No residual wild-type cDNA is detected in raptor mutants (WT Allele, squares). (C) Immunoblot with a N-terminal anti-Raptor antibody. Total protein lysates were derived from raptor wild types (+/+), heterozygotes (+/−) and mutants (−/−). This blot displays two biological replicates. The membrane was stained using anti-Gapdh antibody as a loading control. The uncropped anti-Raptor blot is shown in Fig. S3. (D) Graph of relative Raptor protein level from the heads of 4 dpf raptor wild-type (circle), heterozygous (triangle) or raptor mutant (square) fish. Raptor protein levels are significantly reduced, albeit not absent, in mutant fish. The statistical analyses were conducted using one-way ANOVA followed by Tukey's honest significant difference (HSD) post-hoc test for multiple comparisons, *P<0.05, **P<0.01. Data are mean±s.e.m. |
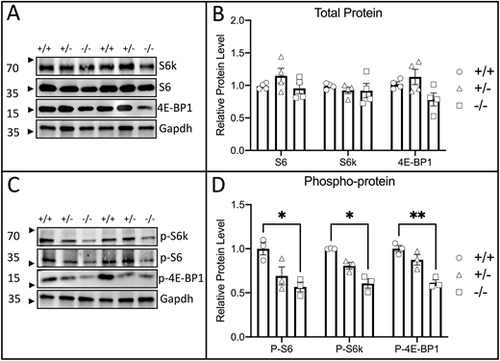
Zebrafish raptor mutants have reduced mTORC1 activity. (A) Representative immunoblots targeting total protein for mTORC1 targets S6k, S6 and 4E-BP1. Total protein lysates were derived from raptor wild types (+/+), heterozygotes (+/−) and mutants (−/−). This blot displays two biological replicates. (B) Graph of relative total protein levels for mTORC1 target proteins in raptor wild types (circles), heterozygotes (triangles) and mutants (squares). Each point is one biological replicate. Differences are not statistically significant. (C) Representative immunoblots targeting phosphorylated protein for mTORC1 targets S6k, S6 and 4E-BP1. Total protein lysates were derived from raptor wild types (+/+), heterozygotes (+/−) and mutants (−/−). This blot displays two biological replicates. (D) Graph of relative total phosphorylated protein levels for mTORC1 target proteins in raptor wild types (circles), heterozygotes (triangles) and mutants (squares). Each point is one biological replicate. Levels of phosphoprotein for each mTORC1 target were significantly reduced relative to wild type. For all blots, protein was from the heads of 4 dpf fish. The statistical analyses were conducted using one-way ANOVA followed by Tukey's honest significant difference (HSD) post-hoc test for multiple comparisons, *P<0.05, **P<0.01. Data are mean±s.e.m. |

The craniofacial skeleton and eyes are reduced in raptor mutant fish. (A-C′) Dorsal and ventral views of 4 dpf fish, anterior towards the left. (A-B′) Wild-type (A,A′) and heterozygous (B,B′) fish are indistinguishable from one another. Asterisks in A′ indicate the ceratobranchial cartilages. (C,C′) Mutant fish have dramatically smaller craniofacial skeletal elements and eyes. Mutants display several craniofacial defects, including a smaller ethmoid plate (C, black arrowheads), smaller trabeculae (C, black arrow), loss of ceratobranchials (C), smaller Meckel's cartilage (C′, red arrowheads) and smaller ceratohyal (C′, red arrows). (D-K) Linear measurements of (D) ethmoid plate length, (E) ethmoid plate width, (F) trabecula length, (G) neurocranium length, (H) Meckel's cartilage length, (I) ceratohyal length, (J) eye width and (K) body length. Statistically significant reductions in all measurements except body length were present in mutants. The statistical analyses were conducted using one-way ANOVA followed by Tukey's honest significant difference (HSD) post-hoc test for multiple comparisons, ****P<0.0001. The top and bottom of each box correspond to the third quartile (Q3) and first quartile (Q1), respectively. Each box covers the interquartile range (IQR), where 50% of the data lies. The median is depicted by the horizontal line within each box. The upper whisker extends to the largest value within Q3 + 1.5 * IQR. The lower whisker extends to the smallest value within Q1 - 1.5 * IQR. Any data point outside these whiskers is classified as an outlier. See Mcgill et al. (1978). PHENOTYPE:
|

The trabeculae contain fewer and smaller cells in raptor mutants. (A-C) Measurements of trabecula (A) area, (B) circumference and (C) cell count. Each point is one cell (A,B) or one trabecula (C). (D,E) Representative images of cell size in wild-type (D) and mutant (E) fish. (F,G) Examples of trabeculae cell counts. Each black dot is one cell in wild-type (F) or mutant (G) fish. (D-G) Anterior is towards the left. The statistical comparisons were performed using two-sample t-tests with unequal variances, *P<0.05, **P<0.01, ****P<0.0001. The top and bottom of each box correspond to the third quartile (Q3) and first quartile (Q1), respectively. Each box covers the interquartile range (IQR), where 50% of the data lies. The median is depicted by the horizontal line within each box. The upper whisker extends to the largest value within Q3 + 1.5 * IQR. The lower whisker extends to the smallest value within Q1 - 1.5 * IQR. Any data point outside these whiskers is classified as an outlier. See Mcgill et al. (1978). PHENOTYPE:
|

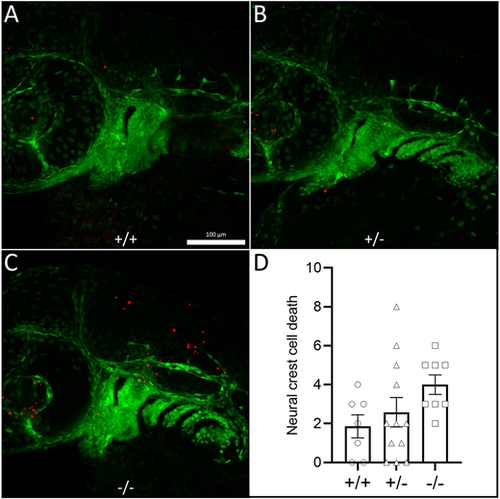
Loss of raptor induces neural crest cell death. (A-C) Confocal images of representative (A) wild-type, (B) heterozygous and (C) raptor mutant fish at 36 hpf. Red puncta are TUNEL-positive cells. Green cells are fli1:EGFP positive. (D) Graph of TUNEL-positive puncta in the first two pharyngeal arches. Each point is one fish: wild type (circles), heterozygote (triangles) and mutant (squares). The statistical analyses were conducted using one-way ANOVA followed by Tukey's honest significant difference (HSD) post-hoc test for multiple comparisons, **P<0.01, ***P<0.001. Data are mean±s.e.m. PHENOTYPE:
|

Chemical inhibition of apoptosis partially rescues the Meckel's cartilage defect. (A) Length of Meckel's cartilage in untreated wild type, untreated mutants and 25 μM caspase-treated mutants. Each point represents one side of the lower jaw (Meckel's cartilage). The statistical analyses were conducted using one-way ANOVA followed by Tukey's honest significant difference (HSD) post-hoc test for multiple comparisons, *P<0.05, ****P<0.0001. (B-D) Ventral views of 4 dpf fish, anterior is towards the left. The top and bottom of each box correspond to the third quartile (Q3) and first quartile (Q1), respectively. Each box covers the interquartile range (IQR), where 50% of the data lies. The median is depicted by the horizontal line within each box. The upper whisker extends to the largest value within Q3 + 1.5 * IQR. The lower whisker extends to the smallest value within Q1 - 1.5 * IQR. Any data point outside these whiskers is classified as an outlier. See Mcgill et al. (1978). PHENOTYPE:
|

Loss of raptor increases autophagy. (A-C″) Confocal images of double-labeling experiment using 36 hpf transgenic CMV:EGFP-lc3 fish stained with lysotracker red. Single z-sections are shown, anterior is towards the left. White arrowheads indicate dual-positive puncta. Representative images of (A-A″) wild-type, (B-B″) heterozygous and (C-C″) raptor mutant fish. (D) Quantification of dual-positive puncta in fish exposed to DMSO (diamonds) or rapamycin (circles) from 6 to 36 hpf. Statistical comparisons were performed using two-sample t-tests with unequal variances assuming a significance level of α=0.05. (E) Quantification of dual-positive puncta in wild-type (circles), heterozygous (triangles) and raptor mutant (squares) fish. The statistical analyses were conducted using one-way ANOVA followed by Tukey's honest significant difference (HSD) post-hoc test for multiple comparisons, *P<0.05, **P<0.01, ***P<0.001. Data are mean±s.e.m. PHENOTYPE:
|

Loss of raptor increases autophagy by 36 hpf, when there are reduced levels of Raptor protein. (A-D) Immunoblot analysis of Lc3 protein at (A,B) 4 dpf and (C,D) 36 hpf. (B,D) Graphs showing the ratio of Lc3-II/Lc3-I relative to wild type. (E,F) Immunoblot analysis of total Raptor protein at 36 hpf in wild types (circles), heterozygotes (triangles) and mutants (squares). Gapdh was used as loading control. Protein level was plotted relative to wild type. The statistical analyses were conducted using one-way ANOVA followed by Tukey's honest significant difference (HSD) post-hoc test for multiple comparisons, *P<0.05. Data are mean±s.e.m. |

Craniofacial and body phenotypes in raptor mutants are partially rescued by chemical inhibition of autophagy. (A-C′) Dorsal and ventral view of (A,A′) wild-type, (B,B′) heterozygous and (C,C′) mutant fish exposed to 1 mM chloroquine from 6 hpf to 4 dpf. Anterior is towards the left. (D-K) Quantification of measurements of (D-I) craniofacial elements, (J) eyes and (K) body length. From left to right for each graph, the genotypes and treatments are: raptor +/+ no treatment, +/− no treatment, −/− no treatment, +/+ 1 mM chloroquine, +/− 1 mM chloroquine and −/− 1 mM chloroquine. The statistical analyses were conducted using one-way ANOVA followed by Tukey's honest significant difference (HSD) post-hoc test for multiple comparisons, *P<0.05, **P<0.01, ***P<0.001. The top and bottom of each box correspond to the third quartile (Q3) and first quartile (Q1), respectively. Each box covers the interquartile range (IQR), where 50% of the data lies. The median is depicted by the horizontal line within each box. The upper whisker extends to the largest value within Q3 + 1.5 * IQR. The lower whisker extends to the smallest value within Q1 - 1.5 * IQR. Any data point outside these whiskers is classified as an outlier. See Mcgill et al. (1978). PHENOTYPE:
|

Craniofacial and body phenotypes in raptor mutants are partially rescued by genetic inhibition of autophagy. (A-D′) Dorsal and ventral view of 4 dpf fish, anterior is towards the left. (E-L) Measurements of (E-J) craniofacial elements, (K) eye width and (L) body length. From left to right, the genotypes are: raptor+/+; atg7+/+, raptor+/+; atg7−/−, raptor−/−; atg7+/+and raptor−/−; atg7−/−. The statistical analyses were conducted using one-way ANOVA followed by Tukey's honest significant difference (HSD) post-hoc test for multiple comparisons, *P<0.05, **P<0.01, ***P<0.001. The top and bottom of each box correspond to the third quartile (Q3) and first quartile (Q1), respectively. Each box covers the interquartile range (IQR), where 50% of the data lies. The median is depicted by the horizontal line within each box. The upper whisker extends to the largest value within Q3 + 1.5 * IQR. The lower whisker extends to the smallest value within Q1 - 1.5 * IQR. Any data point outside these whiskers is classified as an outlier. See Mcgill et al. (1978). |
Chemical inhibition of autophagy with chloroquine reduces neural crest cell death in raptor mutants. Confocal images of representative (A) wild-type, (B) heterozygous and (C) mutant fli1:EGFP fish at 36 hpf. All fish were exposed to 1 mM chloroquine from 6 hpf to 4 dpf. Red puncta are TUNEL-positive cells. (D) Graph of TUNEL-positive puncta in the first two pharyngeal arches. Each point is one fish: wild types (circles), heterozygotes (triangles) and mutants (squares). The statistical analyses were conducted using one-way ANOVA followed by Tukey's honest significant difference (HSD) post-hoc test for multiple comparisons. Data are mean±s.e.m. PHENOTYPE:
|

ZFIN is incorporating published figure images and captions as part of an ongoing project. Figures from some publications have not yet been curated, or are not available for display because of copyright restrictions. EXPRESSION / LABELING:
|
|
ZFIN is incorporating published figure images and captions as part of an ongoing project. Figures from some publications have not yet been curated, or are not available for display because of copyright restrictions. |
|
Unillustrated author statements PHENOTYPE:
|