FIGURE SUMMARY
Title

Zebrafish Mbd5 binds to RNA m5C and regulates histone deubiquitylation and gene expression in development metabolism and behavior

Authors
Guo, J., Zou, Z., Dou, X., Zhao, X., Wang, Y., Wei, L., Pi, Y., Wang, Y., He, C., Guo, S.
Source
Full text @ Nucleic Acids Res.

mbd5 is essential for zebrafish embryonic development. (A) Schematic of the zebrafish mbd5 gene structure and two isoforms. (B) Whole mount in situ hybridization of mbd5 from 1-cell stage to 5 days post fertilization (dpf). (C) Quantitative Real-Time PCR (qRT-PCR) analysis of mbd5 expression from 8-cell stage to 5 dpf. The expression of mbd5 at 4 dpf was normalized as 1 to calculate relative levels of other groups. β-actin was used as the internal standard. (D) Images of 3 dpf larval zebrafish injected with ctrl MO (d’), MO targeting the 5′untranslated region of mbd5 (5′ UTR MO) (d’’), which showed ventrally curved body and pericardial edema phenotypes that were partially rescued by co-injection of zebrafish mbd5 isoform2 (mbd5iso2) mRNA (d’’’). (E) Phenotypic ratios induced by control MO, 5′ UTR MO and 5′ UTR MO con-injected with the mbd5iso2 mRNA. (F) Quantification of abnormal phenotypic ratios in different experimental groups shows that 5′ UTR MO-induced phenotypes are not due to cell death triggered by p53-mediated apoptosis and are not detected in mbd5ΔMBD CRISPR knockout mutants injected with the 5′ UTR MO. Data are collected from three independent experiments and analyzed using two-way ANOVA followed by Dunnett's multiple comparison test. Mean ± S.D. is shown. N = 71 (Ctrl MO), N = 56 (UTR MO), N = 62 (UTR MO + p53 MO), N = 57 (UTR MO + MZmbd5 ΔMBD). Ns, not significant; ** P < 0.01; *** P < 0.001. (G) Western blot using a custom Mbd5 antibody shows reduced Mbd5 protein levels in the 5′ UTR morphants compared to controls. Scale bar, 200 μm.

Germ-line knockouts of mbd5 are adult viable and suffer from behavioral abnormalities. (A) Predicted amino acid sequences of wild type and mbd5 mutant alleles. (BD) Western-blot shows reduced Mbd5 protein in different mbd5 mutant alleles. (EF) Locomotor behavioral analysis of the 7 dpf progeny from mbd5+/ΔMBD in-crosses upon treatment with 2.5mM Pentylenetetrazol (PTZ). The following numbers of individuals were obtained from the in-cross: mbd5+/+, N = 10; mbd5+/ΔMBD, N = 20; mbd5ΔMBD, N = 18. because some larvae did not move after PTZ treatment, the following numbers were used for data analysis: mbd5+/+, N = 7; mbd5+/ΔMBD, N = 20; mbd5ΔMBD, N = 17. (G) Locomotor defects in maternal-zygotic mbd5ΔMBD mutants and hyperactivity measured by average velocity after 2.5 mM PTZ treatment, N = 24. (HK) Representative heat maps of adult ctrl (H, left) and mbd5ΔMBD (H, middle) zebrafish in a novel-tank assay virtually divided to top, middle and bottom zones (H, right). Locomotor behavioral analysis shows that the average distance moved (I) and average velocity (J) are significantly reduced in mbd5ΔMBD mutants comparing to controls. The time spent in different zones (K) shows no difference between mbd5ΔMBD mutants and controls. N = 13. Each value represents mean ± SD, ns, no significance, *P< 0.05, ** P< 0.01, *** P< 0.001.

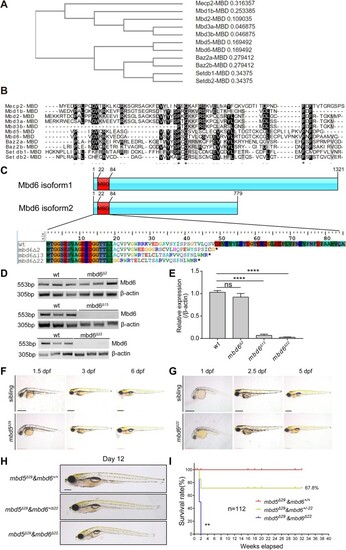
CRISPR/Cas9-mediated germ-line disruption of Mbd6, a MBD protein closely related to Mbd5, reveals redundant function in larval growth and physiology. (A) Phylogenetic analysis of the MBD domain-containing proteins. (B) Protein alignment of the MBD domain. Asterisks represent identical amino acids among the members. Periods indicate that the amino acid is identical or similar across the members. (C) Schematic analysis of the protein variants of Mbd6 and predicted amino acid sequence of wild type and different alleles of mbd6 mutants. (D) Semi-quantitative RT-PCR analysis reveals the mbd6 mRNA expression in mbd6Δ2, mbd6Δ13 and mbd6Δ22 alleles. β-actin was used as the internal control. (E) Statistical analysis of the mbd6 mRNA expression in mbd6Δ2, mbd6Δ13 and mbd6Δ22 alleles. Value in each column represents mean ± SD, ns, no significance, ****P< 0.0001. (FG) Whole-mount lateral view of mbd5Δ29 and mbd6Δ22 mutants at indicated developmental stages under bright field condition. At least 10 were examined for each condition. (H) Lateral view of mbd5Δ29& mbd6Δ22 double mutants and those siblings at 12 dpf. N = 48 (mbd5Δ29& mbd6+/+, N = 12; mbd5Δ29& mbd6+/Δ22, N = 28; mbd5Δ29& mbd6Δ22, N = 8). (I) Survival analysis of the progeny of mbd5ΔMBD& mbd6+/Δ22 in cross during 32 weeks after birth. N = 112, Log-rank (Mantel–Cox) test, ** P< 0.01. Scale bar: 0.5 mm (F, G).

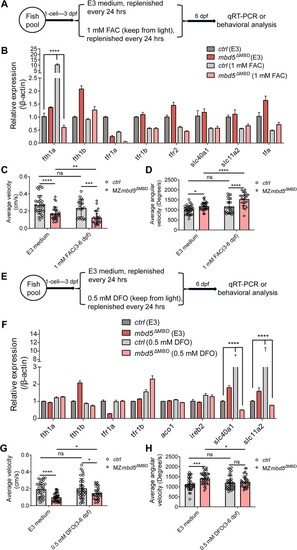
Alterations in iron metabolism contribute to behavioral abnormalities in the mbd5 germline KO mutant. (A) Schematic of FAC treatment prior to gene expression or behavioral analysis. (B) Quantitative RT-PCR analysis of iron metabolism-associated genes in mbd5ΔMBD mutants upon FAC treatment. (C, D) Scatter plots of average velocity (C) and average angular velocity (D) in mbd5ΔMBD mutants treated with FAC. (E) Schematic of DFO treatment. (F) Quantitative RT-PCR analysis of iron metabolism-associated genes in mbd5ΔMBD mutants upon DFO treatment. (G, H) Scatter plots of average velocity (G) and average angular velocity (H) in mbd5ΔMBD treated with DFO. All data in (C, D, G, H) represent mean ± SD, N = 36, two-way ANOVA followed by Dunnett's multiple comparisons test. ns, no significance, *P< 0.05, **P< 0.01, ***P< 0.001, ****P< 0.0001.

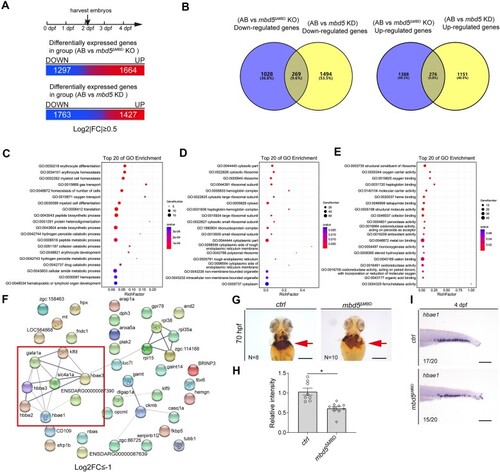
RNA-seq analyses uncover significantly down-regulated biological processes and pathways and highlight deficiency of erythroid differentiation common in both mbd5ΔMBD KO and mbd5 KD embryos. (A) Schematic of staged embryo collection and resulted differentially expressed genes in mbd5ΔMBD KO and mbd5 KD samples at 52 hpf at the indicated threshold. (B) Venn diagrams of genes downregulated (left) and up-regulated (right) in KO and KD compared to AB WT. (C–E) Gene ontology (GO) analysis of commonly downregulated genes shown in (B, left) reveals significantly altered biological processes (C), cellular components (D) and molecular functions (E) upon disruption of mbd5. (F) Protein-associated networks analysis (https://string-db.org/) of commonly downregulated genes shown in (B, left) highlights a deficit in erythroid differentiation. (GH) O-Dianisidine staining of hemoglobin at 70 hpf and quantification of relative staining intensity. P= 0.035, Student's t-test. (I) Images of hbae1 in situ show reduced expression in mbd5ΔMBD KO larvae. Scale bar, 200 μm (G, I).

In vivo transcriptomic analyses in both mbd5ΔMBD KO and Tg[zhsp70l:FLAGmbd5iso2-E2AGFP] overexpression larval zebrafish reveal a critical role of Mbd5 in activating genes implicated in ASD. (A) Schematic of transgenic larval collection and statistical analysis of the differentially expressed genes in mbd5ΔMBD KO and Tg[zhsp70l:FLAGmbd5iso2-E2AGFP] overexpression samples at 7 dpf at the set threshold. (B) Venn diagram analysis of down-regulated genes in AB vs mbd5ΔMBD KO and up-regulated genes in Tg(ctrl) vs Tg[zhsp70l:FLAGmbd5iso2-E2AGFP]. (C) Venn diagram analysis of up-regulated genes in AB vs mbd5ΔMBD KO and down-regulated genes in Tg(ctrl) vs Tg[zhsp70l:FLAGmbd5iso2-E2AGFP]. (D–F) GO analysis based on commonly activated genes in (B) reveal significant changes in biological process (D), cellular component (E) and molecular function (F). (G, H) Expression level of genes associated with synaptic development (G) and signaling (H) were validated through qRT-PCR analysis in mbd5ΔMBD mutants. Each value in (G, H) represents mean ± SD, **P< 0.01, ***P< 0.001, ****P< 0.0001.

Mbd5 preferentially binds to m5C-modified mRNAs and regulates target transcript abundance. (A) Schematics showing the analyses of nucleic acids crosslinked to Mbd5 by UV irradiation. (B) Immunoblotting showing the detection of biotinylated nucleic acids crosslinked to Mbd5 upon RNase or DNase treatments. The arrow points to the Mbd5 protein band. The two bands detected in the RNase A-treated and RNase A- & DNase I-treated samples represent endogenous biotinylated proteins. (C) Quantification of m5C abundance in immunoprecipitated Mbd5-bound RNA. As a control, Mbd5 does not enrich m6A-modified RNA. (D) EMSA assay analyzing binding preference of purified recombinant Mbd5-GFP to RNA oligos (top) or dsDNA (bottom) end-labeled with Alexa Fluor 594 dye. (E) Enrichment of RNA m5C signal on Mbd5 binding sites. Density plots were generated by plotHeatmap function provided by deeptools package, using the Mbd5 CLIP-seq bigWig files and bed files from the published RNA m5C bisulfite sequencing (44). (F) Scatter plot showing the differentially expressed genes (left) and Mbd5 direct targets (right) upon mbd5 MO treatment in zebrafish larvae (76 hpf). P values were determined by DESeq2 algorithm with a Wald test and were corrected for multiple testing using the Benjamini and Hochberg method. (G) Boxplot showing the average m5C modification fractions of downregulated (Down) or upregulated (Up) genes in the 76 hpf morphants. **** P < 0.0001. Student's t-test. (H) Heatmaps showing the number of Mbd5 binding peaks revealed by CLIP-seq (#Mbd5 peaks) and changes in RNA abundance upon mbd5 MO treatment (Log2 fold change of RNA) on selective genes important in autism and erythrocyte development. (I) IGV tracks showing the binding of Mbd5 to selective genes (hbae3, hbbe1.1, hbbe2).

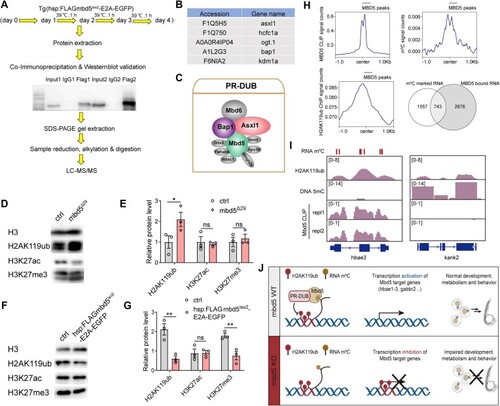
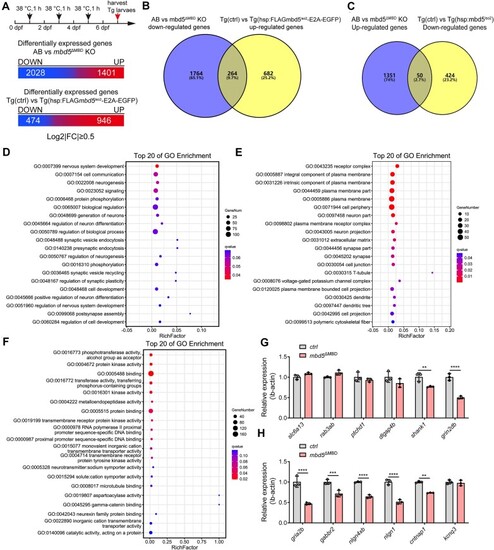
Mbd5 interacts with PR-DUB and is necessary and sufficient to promote deubiquitylation. (A) Schematic of the experimental flow of in vivo co-IP and mass spectrometry. (B) A table listing all proteins belonging to the PR-DUB complex identified in LC–MS/MS. (C) Schematic diagram of the PR-DUB complex. (DG) Representative images of western-blot and quantification of the expression level of H2AK119ub1, H3K27ac and H3K27me3 in mbd5Δ29 mutants (D, E), and in Tg[zhsp70l:FLAGmbd5iso2-E2AGFP] (F-G). H3 was used as the internal control. All data in E and G represent mean ± SEM, ns, no significance, *P< 0.05, **P< 0.01. (H) Enrichment of the Mbd5 CLIP signal (top left), RNA m5C signal (top right), and histone H2AK119ub1 (bottom left) on Mbd5 targets. The Venn diagram depicts the overlap between m5C-marked RNAs and Mbd5-bound RNAs. The density plot (top right) was generated by plotHeatmap function provided by deeptools package, using the Mbd5 CLIP-seq bigWig files and bed files from the published RNA m5C bisulfite sequencing (44). The density plot (bottom left) was generated by plotHeatmap function provided by deeptools package, using the Mbd5 CLIP-seq bigWig files and bed files from H2AK119ub1 ChIP-seq datasets (52). (I) IGV tracks showing DNA 5mC, RNA m5C, and H2AK119ub1 occupancy on an example Mbd5 target (hbae3) and an example non-Mbd5 target (kank2). (J) A model: the zebrafish Mbd5 protein is a mRNA m5C reader. By binding to nascent m5C-modified mRNA, it recruits or stabilizes the PR-DUB complex to promote histone deubiquitylation at H2AK119 sites. Mbd5 thus regulates the transcription of genes required for normal development, metabolism, and behavior.

Acknowledgments
This image is the copyrighted work of the attributed author or publisher, and ZFIN has permission only to display this image to its users. Additional permissions should be obtained from the applicable author or publisher of the image. Full text @ Nucleic Acids Res.