IMAGE

Figure 1.

ID
ZDB-IMAGE-240509-63
Source
Figures for Guo et al., 2024
Image
Figure Caption

Figure 1.

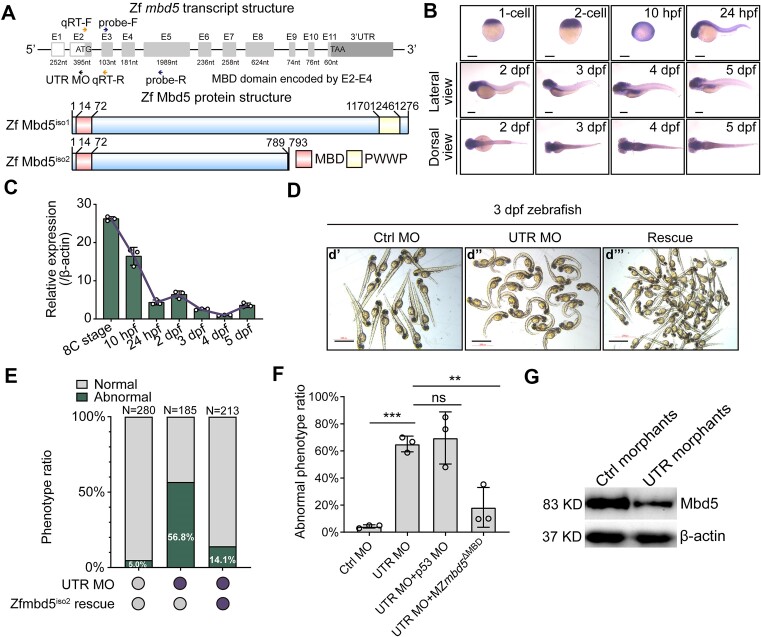
mbd5 is essential for zebrafish embryonic development. (A) Schematic of the zebrafish mbd5 gene structure and two isoforms. (B) Whole mount in situ hybridization of mbd5 from 1-cell stage to 5 days post fertilization (dpf). (C) Quantitative Real-Time PCR (qRT-PCR) analysis of mbd5 expression from 8-cell stage to 5 dpf. The expression of mbd5 at 4 dpf was normalized as 1 to calculate relative levels of other groups. β-actin was used as the internal standard. (D) Images of 3 dpf larval zebrafish injected with ctrl MO (d’), MO targeting the 5′untranslated region of mbd5 (5′ UTR MO) (d’’), which showed ventrally curved body and pericardial edema phenotypes that were partially rescued by co-injection of zebrafish mbd5 isoform2 (mbd5iso2) mRNA (d’’’). (E) Phenotypic ratios induced by control MO, 5′ UTR MO and 5′ UTR MO con-injected with the mbd5iso2 mRNA. (F) Quantification of abnormal phenotypic ratios in different experimental groups shows that 5′ UTR MO-induced phenotypes are not due to cell death triggered by p53-mediated apoptosis and are not detected in mbd5ΔMBD CRISPR knockout mutants injected with the 5′ UTR MO. Data are collected from three independent experiments and analyzed using two-way ANOVA followed by Dunnett's multiple comparison test. Mean ± S.D. is shown. N = 71 (Ctrl MO), N = 56 (UTR MO), N = 62 (UTR MO + p53 MO), N = 57 (UTR MO + MZmbd5 ΔMBD). Ns, not significant; ** P < 0.01; *** P < 0.001. (G) Western blot using a custom Mbd5 antibody shows reduced Mbd5 protein levels in the 5′ UTR morphants compared to controls. Scale bar, 200 μm.

Acknowledgments
This image is the copyrighted work of the attributed author or publisher, and ZFIN has permission only to display this image to its users. Additional permissions should be obtained from the applicable author or publisher of the image. Full text @ Nucleic Acids Res.