FIGURE SUMMARY
Title

Lithium: effects in animal models of vanishing white matter are not promising

Authors
Witkamp, D., Oudejans, E., Hoogterp, L., Hu-A-Ng, G.V., Glaittli, K.A., Stevenson, T.J., Huijsmans, M., Abbink, T.E.M., van der Knaap, M.S., Bonkowsky, J.L.
Source
Full text @ Front. Neurosci.

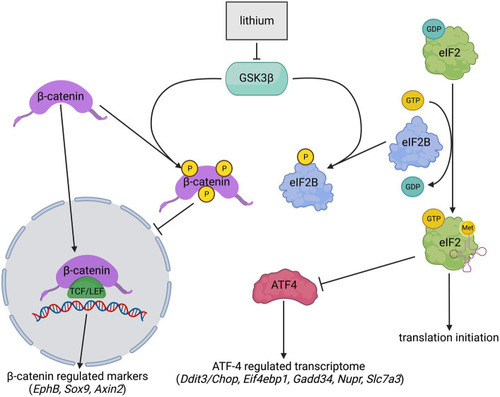
Simplified schematic overview of lithium effects on GSK3β, eIF2B, and β-catenin. Lithium inhibits GSK3β activity. GSK3β inhibition lowers eIF2B phosphorylation (yellow) levels resulting in increased eIF2B activity and presumably downregulated expression of ATF4 and the ATF4-regulated transcriptome. GSK3β inhibition also stabilizes β-catenin by impeding its phosphorylation (yellow) at Ser33, Ser37, and Thr41. Phosphorylated β-catenin is highly unstable and was therefore not quantified. Non-phosphorylated β-catenin moves to the nucleus and joins with a member of the T-cell factor/lymphoid enhancer factor (TCF/LEF) family of transcription factors. This joining upregulates the expression of several genes, including EphB, Sox9, and Axin2. ➔ indicates stimulation; --| indicates inhibition. The image was created with BioRender.com.

Lithium improves motor deficits in mutant eif2b5zc103/zc103 zebrafish. WT (circles) and eif2b5zc103/zc103 (VWM; squares) zebrafish were treated with placebo (black; WT: n = 48, VWM: n = 38) or 1 mM lithium (blue; WT: n = 12, VWM: n = 26) and assessed on distance moved, moving time, and velocity at 7 dpf. The graphs show individual and mean values, +/− SEM. The shown motor behavior parameters differ significantly in placebo-treated WT versus placebo-treated eif2b5zc103/zc103 zebrafish (p < 0.0001; not indicated, Supplementary Data Sheet S1). Treatment effects were statistically analyzed using an unpaired t-test or Mann–Whitney test (VWM, distance moved; Supplementary Data Sheet S1). *p < 0.05 and **p < 0.01.

Lithium induces more pronounced polydipsia in WT than in 2b4he2b5ho mutant mice. WT (circles) and 2b4he2b5ho mutant (VWM; squares) mice were i.p. injected with placebo (black) or 200 mg/kg lithium (blue) (n = 8 per treatment, per genotype). Water intake (ml/g) is shown per cage housing two mice (individual and mean values, +/− SEM). Statistical analysis was performed with a mixed-effects model with post-hoc Tukey’s multiple comparison test (Supplementary Data Sheet S1). ****p < 0.0001; placebo-lithium differences: ____, WT-VWM difference: ----. Raw data are in Supplementary Data Sheet S2.

Lithium does not increase the expression and activity of non-phosphorylated β-catenin. WT (circles) and 2b4he2b5ho mutant (VWM; squares) mice (n = 8 per treatment, per genotype) were i.p. injected daily with placebo (black) or 200 mg/kg lithium (blue) for 1 week. Mice were terminated approximately 8 h after the final injection. Cerebellar RNA and protein samples were derived from the same lysate. Levels of non-phosphorylated β-catenin were determined using the Western blot (n = 3–4). Lithium treatment effects on indicated β-catenin-regulated markers were determined with qPCR (n = 6–8) (Sorcs1 and Nrxn as reference). Lithium differences were analyzed with two-way ANOVAs (Supplementary Data Sheet S1). The graphs show individual and mean values, +/− SEM. Raw data are available in Supplementary Data Sheet S2.

Lithium subtly increases the expression of the ATF4-regulated transcriptome in the mouse brain. WT (circles) and 2b4he2b5ho mutant (VWM; squares) mice were i.p. injected daily with 200 mg/kg lithium (blue) or placebo (black) for 1 week (n = 8 per treatment, per genotype). Mice were terminated approximately 8 h after injection. Cerebellar RNA and protein samples were derived from the same lysate. Lithium effects on indicated ISR markers were determined using the Western blot for eIF2α phosphorylation (n = 7–8) and qPCR for mRNA expression (Sorcs1 and Nrxn as reference, n = 8). The graphs show individual and mean values, +/− SEM. The shown ISR markers differ significantly in placebo-treated WT versus placebo-treated 2b4he2b5ho mice (p < 0.05; not indicated, Supplementary Data Sheet S1). Treatment effects were statistically analyzed using an unpaired t-test or Mann–Whitney test (VWM: Ddit3/Chop, Gadd34, Nupr; Supplementary Data Sheet S1). Raw data are available in Supplementary Data Sheet S2. *p < 0.05 and **p < 0.01.

Acknowledgments
This image is the copyrighted work of the attributed author or publisher, and ZFIN has permission only to display this image to its users. Additional permissions should be obtained from the applicable author or publisher of the image. Full text @ Front. Neurosci.