FIGURE SUMMARY
Title

Calcium signaling mediates proliferation of the precursor cells that give rise to the ciliated left-right organizer in the zebrafish embryo

Authors
Abdel-Razek, O., Marzouk, A., MacKinnon, M., Guy, E.T., Pohar, S.A., Zhushma, E., Liu, J., Sia, I., Gokey, J.J., Tay, H.G., Amack, J.D.
Source
Full text @ Front Mol Biosci

Dorsal forerunner cells give rise to the ciliated Kupffer’s vesicle that functions as the left-right organizer in the zebrafish embryo. (A) Diagram of early zebrafish embryo development. Dorsal forerunner cells (DFCs) are specified at the 50% epiboly stage and then form Kupffer’s vesicle (KV) by the 6 somite stage at 12 h post-fertilization (hpf). Cilia-generated fluid flow inside KV directs asymmetric expression of spaw and downstream asymmetric heart development. For all pharmacological treatments herein, drugs were added to embryos at the 60% epiboly stage (6.5 hpf) and removed at 70% epiboly (7.5 hpf). Created using BioRender.com. (B) Confocal microscopy images of DFCs and the ciliated KV. DFC/KV cells are labeled with membrane-localized EGFP expression in Tg(sox17:EGFP-caax) embryos. KV cilia are labeled with anti-acetylated tubulin antibodies. (C) RNA in situ hybridization of spaw expression in left lateral plate mesoderm (arrow) in a wild-type embryo. Dashed line marks the embryo midline. (D) Left-sided jogging (dashed arrow) of the heart visualized by EGFP expression driven by a myl7 promoter in cardiomyocytes in a wild-type embryo.

A targeted pharmacological screen to identify pathways that mediate DFC proliferation. (A) To quantify DFC proliferation rate, Tg(sox17:EGFP-caax) embryos were fixed at the 70% epiboly stage. Antibodies that recognize EGFP were used to label DFCs (green), and phosphorylated Histone H3 (pHH3) antibodies were used to identify cells in mitosis (magenta). DAPI staining (cyan) was used to mark all nuclei. In the merged image, arrows point out mitotic DFCs and asterisks point out mitotic neighboring (non-DFC) cells. (B) Results from the pharmacological screen. See Supplementary Table S1 for drug targets. The number of pHH3-positive DFCs was used to calculate a mitotic index (the percentage of DFCs in mitosis). Bar graphs indicate average values and error bars represent one standard deviation. Each circle on the graphs represents results from an individual embryo. The average mitotic index of DFCs in drug treated embryos was compared to control (DMSO treated) embryos from the same experimental group. An unpaired two-tailed t-test with Welch’s correction was used for statistical analysis. See Supplementary Table S2 for n values and p values. * = significant difference; ns = not significant.

Validation of screen results that identify Ca2+ signaling as a regulator of DFC proliferation. (A) Diagram of SERCA function to pump Ca2+ from the cytoplasm into endoplasmic reticulum stores, and the action of the small molecules thapsigargin (Thaps) and cyclopiazonic acid (CPA) to inhibit SERCA. Created using BioRender.com. (B) Treating embryos with 1 μM Thaps or 100 μM CPA significantly reduced the mitotic index of DFCs as compared to negative control DMSO treated embryos. Bar graphs indicate average values and error bars represent one standard deviation. Each circle on the graphs represents results from an individual embryo. An unpaired two-tailed t-test with Welch’s correction was used for statistical analysis. * = significant difference. n = number of embryos analyzed. (C) Representative merged images of pHH3 staining in Tg(sox17:EGFP-caax) embryos treated with 1% DMSO (negative control), 1 μM Thaps, or 100 μM CPA. Arrows point out mitotic DFCs and asterisks point out mitotic neighboring (non-DFC) cells.

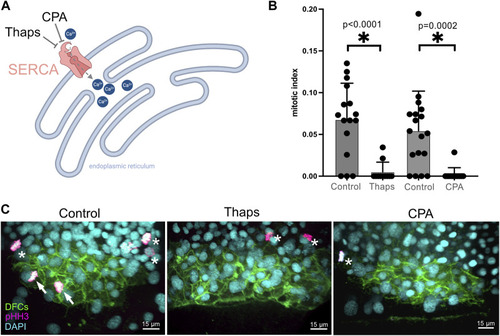
SERCA inhibitor treatments during epiboly reduce the number of ciliated KV cells and disrupt left-right patterning of the embryo. (A) Representative images of the ciliated KV in Tg(sox17:EGFP-caax) embryos treated with 1% DMSO (control) or 1 μM Thapsigargin (Thaps). KV cells are labeled with membrane-localized EGFP expression (green), and KV cilia are labeled with anti-acetylated tubulin antibodies (magenta). (B–D) Treating embryos with 1 μM Thapsigargin during epiboly stages reduced the area of KV (B), the number of cilia in KV (C), and the number of cells in KV (D) relative to DMSO treated controls. Bar graphs indicate average values and error bars represent one standard deviation. Each circle on the graphs represents results from an individual embryo. An unpaired two-tailed t-test with Welch’s correction was used for statistical analysis. * = significant difference. (E) Representative images of normal left-sided spaw expression (arrows) in a DMSO control embryo and bilateral expression in a thapsigargin treated embryo. (F) Most DMSO control embryos had left-sided spaw expression, whereas spaw was largely bilateral, and in some cases absent or right-sided in thapsigargin treated embryos. (G) Representative images of normal leftward heart jogging (dashed arrow) in a DMSO treated control embryo and midline jogging in a thapsigargin treated embryo. The heart tube was labeled by EGFP expression in cardiomyocytes. (H) Leftward heart jogging was observed in most control embryos. In contrast, the heart often jogged along the midline or to the right in thapsigargin treated embryos. n = number of embryos analyzed.

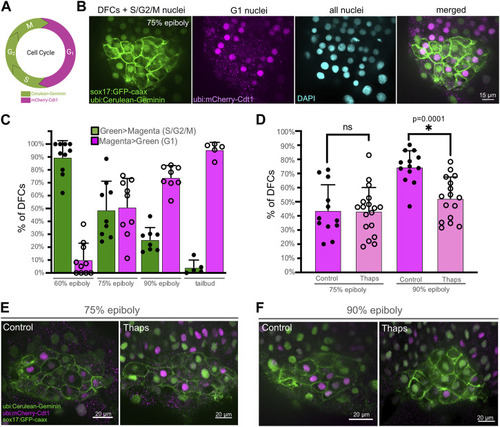
SERCA activity meditates progression of DFCs through the S/G2 phases of the cell cycle. (A) Diagram of transgene expression during the cell cycle in Dual-FUCCI transgenic zebrafish. Created using BioRender.com. (B) Representative image of a double Tg(Dual-FUCCI); Tg(sox17:EGFP-caax) embryo at the 75% epiboly stage. DFC cell membranes are labeled by Tg(sox17:EGFP-caax) expression (green), and fluorescent antibody staining was used to detect mCherry-Cdt1 (magenta) and cerulean-Geminin (green). DAPI staining (cyan) was used to mark all nuclei. (C) Analysis of cell cycle status of DFCs in wild-type Tg(Dual-FUCCI); Tg(sox17:EGFP-caax) embryos at different developmental stages. Bar graphs indicate average values and error bars represent one standard deviation. Each circle on the graphs represents results from an individual embryo. (D) Quantification of the percentage of DFCs in G1 (magenta > green) in Tg(Dual-FUCCI); Tg(sox17:EGFP-caax) embryos treated with 1% DMSO (control) or 1 μM thapsigargin at 60% epiboly for 60 min and then fixed at 75% epiboly or 90% epiboly. An unpaired two-tailed t-test with Welch’s correction was used for statistical analysis. * = significant difference; ns = not significant. (E, F) Representative images of control or thapsigargin treated Tg(Dual-FUCCI); Tg(sox17:EGFP-caax) embryos at the 75% epiboly (E) or 90% epiboly (F) stage.

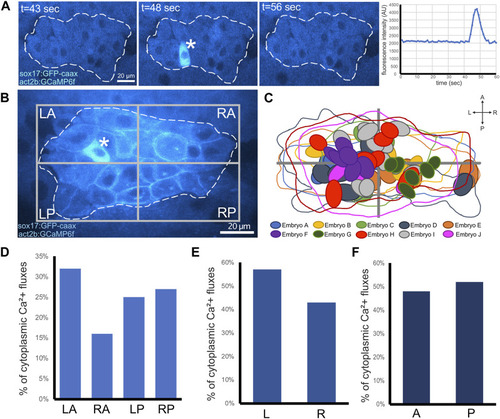
Visualization of cytoplasmic Ca2+ flux events in DFCs. (A) Confocal time-lapse images of a single Z-plane through DFCs in a Tg(act2b:GCaMP6f); Tg(sox17:EGFP-caax) embryo at the 60% epiboly stage. Changes in Ca2+ concentration (GCaMP6f fluorescence intensity) are visualized by changes in intensity of the cyan hot lookup table (FIJI software). The asterisk marks a DFC that undergoes a transient cytoplasmic Ca2+ flux. Dashed white line indicates the boundary of the DFC cluster. The graph plots GCaMP6f fluorescence intensity in the cytoplasm in the DFC over time. t = time in sec. AU = arbitrary units. (B) Image of a representative DFC cluster in a Tg(act2b:GCaMP6f); Tg(sox17:EGFP-caax) embryo. Dashed white line indicates the boundary of the DFC cluster, which is used to define left-anterior (LA), right-anterior (RA), left-posterior (LP), and right-posterior (RP) quadrants. The asterisk indicates a DFC cytoplasmic Ca2+ flux event. (C) Overlay of the DFC cluster boundaries and cytoplasmic Ca2+ flux events in all embryos analyzed (n = 56 events from 10 embryos) reveals spatial location of cytoplasmic Ca2+ fluxes in DFCs. (D–F) Quantification of pooled DFC cytoplasmic Ca2+ flux events in DFC quadrants (D), along the LR axis (E), and along the AP axis (F).

Identification of nuclear Ca2+ flux in DFCs. (A) Confocal images of a single Z-plane through DFCs in a Tg(act2b:GCaMP6f); Tg(sox17:EGFP-caax) embryo at the 60% epiboly stage. Changes in Ca2+ concentration (GCaMP6f fluorescence intensity) are visualized by changes in intensity of the cyan hot lookup table (FIJI software). The asterisks mark a transient increase in Ca2+ concentration in the nucleus of a DFC. Dashed white line indicates the boundary of the DFC cluster. t = time in sec. (B) Image of a representative DFC cluster in a Tg(act2b:GCaMP6f); Tg(sox17:EGFP-caax) embryo. Dashed white line indicates the boundary of the DFC cluster, which is used to define quadrants. The asterisk indicates a DFC nuclear Ca2+ flux event. (C) Overlay of the DFC cluster boundaries and locations of nuclear Ca2+ flux events in all embryos analyzed (n = 22 events from nine embryos). (D) Confocal time-lapse images of DFCs in a Tg(act2b:GCaMP6f); Tg(sox17:EGFP-caax) embryo. Following a nuclear Ca2+ flux event (asterisk), the DFC (arrow) rounds up and divides into two daughter cells. t = min:sec.

Acknowledgments
This image is the copyrighted work of the attributed author or publisher, and ZFIN has permission only to display this image to its users. Additional permissions should be obtained from the applicable author or publisher of the image. Full text @ Front Mol Biosci