IMAGE

FIGURE 2

ID
ZDB-IMAGE-231228-127
Source
Figures for Abdel-Razek et al., 2023
Image
Figure Caption

FIGURE 2

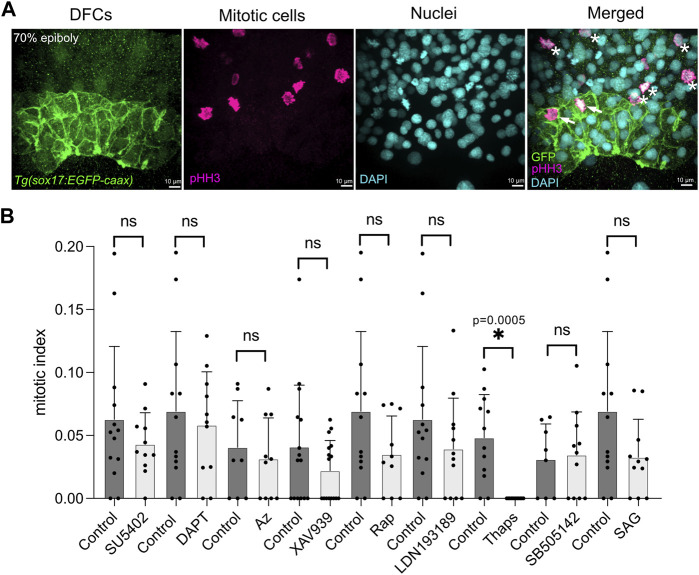
A targeted pharmacological screen to identify pathways that mediate DFC proliferation. (A) To quantify DFC proliferation rate, Tg(sox17:EGFP-caax) embryos were fixed at the 70% epiboly stage. Antibodies that recognize EGFP were used to label DFCs (green), and phosphorylated Histone H3 (pHH3) antibodies were used to identify cells in mitosis (magenta). DAPI staining (cyan) was used to mark all nuclei. In the merged image, arrows point out mitotic DFCs and asterisks point out mitotic neighboring (non-DFC) cells. (B) Results from the pharmacological screen. See Supplementary Table S1 for drug targets. The number of pHH3-positive DFCs was used to calculate a mitotic index (the percentage of DFCs in mitosis). Bar graphs indicate average values and error bars represent one standard deviation. Each circle on the graphs represents results from an individual embryo. The average mitotic index of DFCs in drug treated embryos was compared to control (DMSO treated) embryos from the same experimental group. An unpaired two-tailed t-test with Welch’s correction was used for statistical analysis. See Supplementary Table S2 for n values and p values. * = significant difference; ns = not significant.

Acknowledgments
This image is the copyrighted work of the attributed author or publisher, and ZFIN has permission only to display this image to its users. Additional permissions should be obtained from the applicable author or publisher of the image. Full text @ Front Mol Biosci