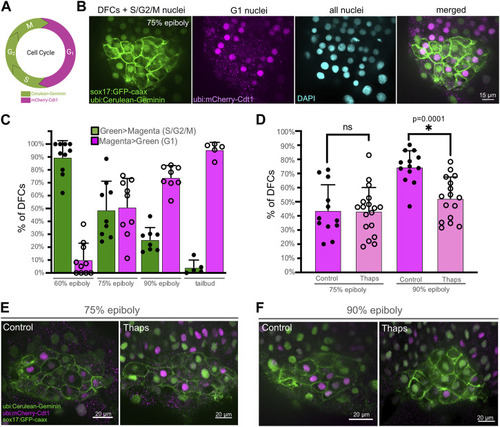
SERCA activity meditates progression of DFCs through the S/G2 phases of the cell cycle. (A) Diagram of transgene expression during the cell cycle in Dual-FUCCI transgenic zebrafish. Created using BioRender.com. (B) Representative image of a double Tg(Dual-FUCCI); Tg(sox17:EGFP-caax) embryo at the 75% epiboly stage. DFC cell membranes are labeled by Tg(sox17:EGFP-caax) expression (green), and fluorescent antibody staining was used to detect mCherry-Cdt1 (magenta) and cerulean-Geminin (green). DAPI staining (cyan) was used to mark all nuclei. (C) Analysis of cell cycle status of DFCs in wild-type Tg(Dual-FUCCI); Tg(sox17:EGFP-caax) embryos at different developmental stages. Bar graphs indicate average values and error bars represent one standard deviation. Each circle on the graphs represents results from an individual embryo. (D) Quantification of the percentage of DFCs in G1 (magenta > green) in Tg(Dual-FUCCI); Tg(sox17:EGFP-caax) embryos treated with 1% DMSO (control) or 1 μM thapsigargin at 60% epiboly for 60 min and then fixed at 75% epiboly or 90% epiboly. An unpaired two-tailed t-test with Welch’s correction was used for statistical analysis. * = significant difference; ns = not significant. (E, F) Representative images of control or thapsigargin treated Tg(Dual-FUCCI); Tg(sox17:EGFP-caax) embryos at the 75% epiboly (E) or 90% epiboly (F) stage.
|
