FIGURE SUMMARY
Title

Genetic model of UBA5 deficiency highlights the involvement of both peripheral and central nervous systems and identifies widespread mitochondrial abnormalities

Authors
Serrano, R.J., Oorschot, V., Palipana, D., Calcinotto, V., Sonntag, C., Ramm, G., Bryson-Richardson, R.J.
Source
Full text @ Brain Commun

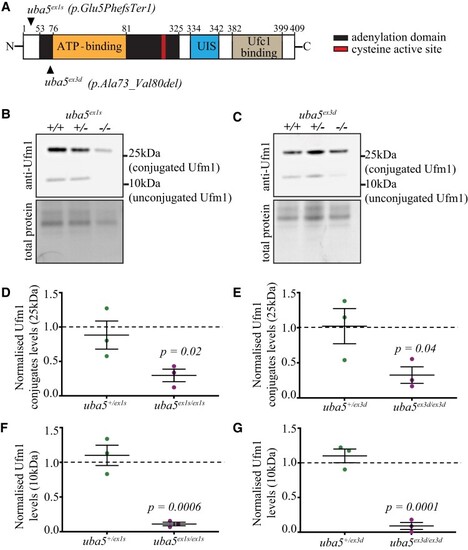
Ufm1 and Ufm1-conjugate levels are reduced in uba5−/− fish at 6 dpf. (A) Schematic of Uba5 wild-type protein and mutation sites in zebrafish. The mutant strains were generated using CRISPR/Cas9 genome editing. The uba5ex1s strain carries a 73-base pair insertion following the ATG, resulting in a frameshift and incorporation of a premature stop after 5 amino acids, whereas the uba5ex3d strain carries a 24-base pair deletion that removes the ATP-binding domain. (B–G) Western blot for Ufm1 and Direct Blue staining for total protein (loading control) on protein lysates obtained at 6 dpf. Ufm1 and Ufm1-conjugate levels were normalized to that of the respective total protein levels. The changes in Ufm1 and Ufm1-conjugate levels in uba5 mutants were determined relative to the levels of wild-type siblings. Statistical significance was calculated using a one-way ANOVA with Dunnett’s post hoc multiple comparison correction test. Data are presented as mean ± SEM for three independent biological replicates, each consisting of a pooled sample of 20–25 embryos. UIS, Ufm1-interacting sequence; Ufc1, ubiquitin-fold modifier conjugating enzyme 1; Ufm1, ubiquitin-fold modifier 1.

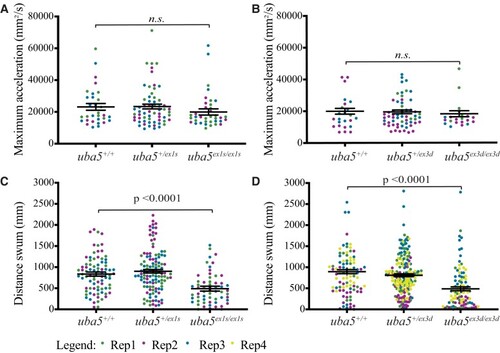
Motor function in uba5 mutants at 6 dpf. (A and B) Quantification of the maximum acceleration recorded from touch-evoked response assays of uba5ex1s/ex1s and uba5ex3d/ex3d fish compared to wild-type siblings at 2 dpf revealed no significant differences. The error bars represent mean ± SD predicted by the linear model statistical test for three independent biological replicates (uba5ex1s allele: n = 10, 7, 14 uba5+/+; n = 20, 18, 23 uba5+/ex1s; n = 17, 10, 10 uba5ex1s/ex1s. uba5ex3d allele: n = 3, 12, 9 uba5+/+; n = 9, 25, 24 uba5+/ex3d; n = 6, 11, 4 uba5ex3d/ex3d). (C and D) Quantification of the distance travelled by uba5ex1s/ex1s and uba5ex3d/ex3d revealed a significant reduction in motor activity at 6 dpf compared to wild-type siblings. The graphs depict raw data for three to four independent experiments plotted with the mean ± SD predicted by the linear model statistical test (uba5ex1s allele: n = 31, 26, 26 uba5+/+; n = 38, 40, 40 uba5+/ex1s; n = 22, 21, 16 uba5ex1s/ex1s. uba5ex3d allele: n = 17, 24, 24, 27 uba5+/+; n = 47, 38, 43, 71 uba5+/ex3d; n = 20, 22, 26, 29 uba5ex3d/ex3d). In each experiment, each dot represents an individual zebrafish. n.s., non-significant; Rep, replicate.

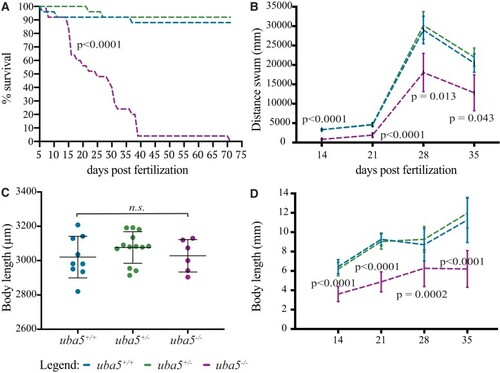
Survival, motor function and growth are impaired in uba5ex1s/ex1s fish. (A) 25 uba5+/+, 25 uba5+/ex1s and 25 uba5ex1s/ex1s embryos were raised, and their survival was analysed. (B) Quantification of the distance travelled showed a significant reduction of the motor function in uba5ex1s/ex1s compared to wild-type siblings. Data are represented as mean ± SD predicted by the linear model statistical test for one biological replicate analysed at 14 (n = 23 uba5+/+; n = 25 uba5+/ex1s; n = 23 uba5ex1s/ex1s), 21 (n = 23 uba5+/+; n = 25 uba5+/ex1s; n = 14 uba5ex1s/ex1s), 28 (n = 23 uba5+/+; n = 23 uba5+/ex1s; n = 12 uba5ex1s/ex1s) and 35 dpf (n = 23 uba5+/+; n = 23 uba5+/ex1s; n = 6 uba5ex1s/ex1s). (C) Measurement of the body length at 5 dpf did not reveal a significant difference between uba5ex1s/ex1s and wild-type siblings (n = 9 uba5+/+; n = 13 uba5ex1s/+; n = 6 uba5ex1s/ex1s). Each dot represents an individual zebrafish. The error bars represent mean ± SD for one biological replicate. n.s., non-significant using a one-way ANOVA. (D) Measurement of the body length at 14 (n = 23 uba5+/+; n = 25 uba5+/ex1s; n = 23 uba5ex1s/ex1s), 21 (n = 21* uba5+/+; n = 25 uba5+/ex1x; n = 14 uba5ex1s/ex1s), 28 (n = 23 uba5+/+; n = 21* uba5+/ex1s; n = 12 uba5ex1s/ex1s) and 35 dpf (n = 23 uba5+/+; n = 23 uba5+/ex1s; n = 5* uba5ex1s/ex1s) demonstrates that uba5ex1s/ex1s are smaller than wild-type siblings at later stages of development. Data are represented as mean ± SD predicted by the linear model statistical test. *These numbers were originally the same as in (B), but we were unable to measure the body length of some fish, and therefore, these were not included in the analysis.

Ultrastructural analysis of the peripheral nerves and skeletal muscle in uba5ex1s/ex1s. (A) Patterning of the peripheral nerves and skeletal muscle at 6 dpf (i–vi). Electron microscopy images show mitochondrial abnormalities, including elongated mitochondria (ii) and degenerating mitochondria (iii), in the nerve terminals of uba5ex1s/ex1s fish (arrowhead). Degradation vacuoles enclosing debris (vi), and autophagic structures associated with mitochondria in the skeletal muscle (v), are also observed. (B) Patterning of the skeletal muscle at 14 dpf shows abnormal mitochondria with swollen cristae (ii) and vacuolated mitochondria (iii) in uba5 mutants (arrowhead). (C) Western blot for Pink1 and Direct Blue staining (loading control) on protein lysates obtained from pooled samples of 25 embryos at 6 dpf. M, mitochondria; NT, nerve terminal; PN, peripheral nerve; SV, synaptic vesicles.

Quantification of total brain and cerebellar volume in uba5ex1s/ex1s animals at 6 dpf. (A) Maximum intensity projections of whole brain from Tg (Huc:EGFP); uba5+/+ and Tg (Huc:EGFP); uba5ex1s/ex1s 6 dpf zebrafish. (B) Total brain and (C) cerebellar volume analyses showed no significant changes in uba5ex1s/ex1s (brain volume n = 9, 4, 4, 8, 9; cerebellar volume n = 10, 4, 4, 8, 9) compared to uba5+/+ (brain volume n = 9, 3, 3, 7, 10; cerebellar volume n = 8, 4, 3, 9, 10). Each dot represents an individual zebrafish. Data represents raw data for five biological replicates plotted with the mean ± SD predicted by the mixed model statistical test. Scale bar = 100 µm. n.s., non-significant; Rep, replicate.

EXPRESSION / LABELING:
Gene:
Fish:
Anatomical Terms:
Stage: Day 6
PHENOTYPE:
Fish:
Observed In:
Stage: Day 6

Ultrastructural analysis of the cerebellum at 14 dpf shows abnormal findings in uba5ex1s/ex1s animals. Membranous swirls (ii, ii′), membrane whorls inside neurons that are indicative of mitochondrial degradation (iv, iv′) and cytoplasmatic condensation (vi, vi′) are observed in uba5ex1s/ex1s mutants (arrowheads) compared to uba5+/+ (i, iii, v). (ii′, iv′, vi′). A higher magnification view of boxed areas.

Acknowledgments
This image is the copyrighted work of the attributed author or publisher, and ZFIN has permission only to display this image to its users. Additional permissions should be obtained from the applicable author or publisher of the image. Full text @ Brain Commun