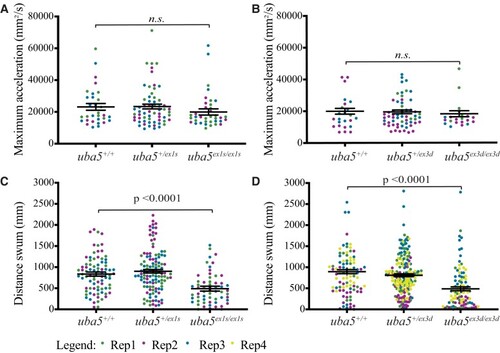
Motor function in uba5 mutants at 6 dpf. (A and B) Quantification of the maximum acceleration recorded from touch-evoked response assays of uba5ex1s/ex1s and uba5ex3d/ex3d fish compared to wild-type siblings at 2 dpf revealed no significant differences. The error bars represent mean ± SD predicted by the linear model statistical test for three independent biological replicates (uba5ex1s allele: n = 10, 7, 14 uba5+/+; n = 20, 18, 23 uba5+/ex1s; n = 17, 10, 10 uba5ex1s/ex1s. uba5ex3d allele: n = 3, 12, 9 uba5+/+; n = 9, 25, 24 uba5+/ex3d; n = 6, 11, 4 uba5ex3d/ex3d). (C and D) Quantification of the distance travelled by uba5ex1s/ex1s and uba5ex3d/ex3d revealed a significant reduction in motor activity at 6 dpf compared to wild-type siblings. The graphs depict raw data for three to four independent experiments plotted with the mean ± SD predicted by the linear model statistical test (uba5ex1s allele: n = 31, 26, 26 uba5+/+; n = 38, 40, 40 uba5+/ex1s; n = 22, 21, 16 uba5ex1s/ex1s. uba5ex3d allele: n = 17, 24, 24, 27 uba5+/+; n = 47, 38, 43, 71 uba5+/ex3d; n = 20, 22, 26, 29 uba5ex3d/ex3d). In each experiment, each dot represents an individual zebrafish. n.s., non-significant; Rep, replicate.
|

