- Title
-
Protocol for generating mutant zebrafish using CRISPR-Cas9 followed by quantitative evaluation of vascular formation
- Authors
- Luo, J., Lu, C., Wang, M., Yang, X.
- Source
- Full text @ STAR Protoc
|
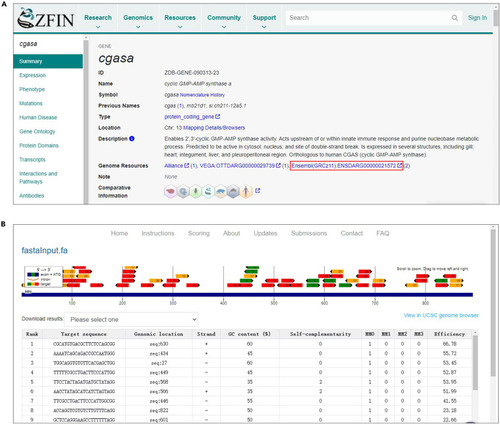
Design the CRISPR targeting sequence (A) Snapshot of the ZFIN browser website showing how to obtain a DNA sequence of interest. (B) Screenshot of the CHOPCHOP web application used to design sgRNAs. |
|
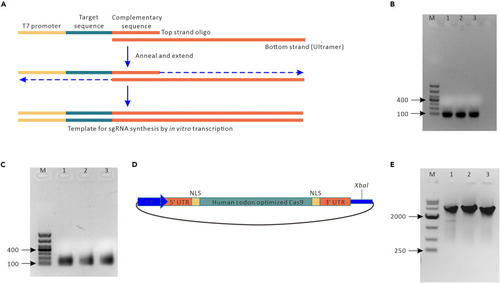
Synthesis of sgRNA and Cas9 mRNA in vitro (A) Schematic of sgRNA synthesis. sgRNAs are synthesized by annealing two oligos. In this schematic, the T7 promoter sequence is depicted in yellow, the 20-bp target sequence in gray‒green (the NGG PAM site is not included in this sequence) and the remaining sgRNA sequence in orange. (B) Oligo assembly of sgRNA oligos. Target-specific oligos are annealed and extended with the generic sgRNA oligo, and the assembled products are run on a 1% agarose gel; Lane M: marker (1 kb). Lanes 1–3, assembled products. (C) The assembled oligos were used as templates for an in vitro transcription reaction. The purified sgRNA was run on a 2% DNA agarose gel. Lane M, marker; Lanes 1–3: synthesized sgRNAs. (D) Structure of the circular pXT7-hCas9 plasmid. Gray green, human codon-optimized Cas9; orange, UTRs; blue, T7 promoter sequence; yellow, NLS sequence. (E) In vitro transcription of Cas9 mRNA on a 1% DNA agarose gel after purification and DNase treatment. Lane M, marker (10 kb ladder); Lane 1, circular DNA template; Lane 2, digested linear DNA template; Lane 3, purified Cas9 mRNA. |
|
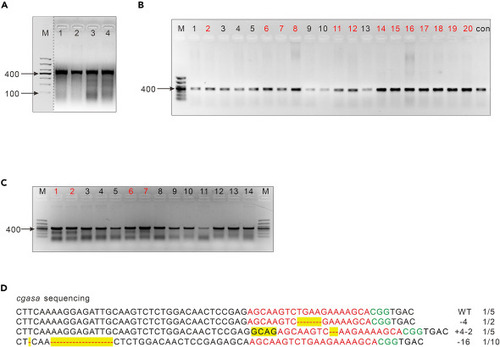
Genotyping PCR assays (A) Representative image of agarose gel results of the T7EI assay from two repeated experiments. Lanes 1 and 2 are from the control group (wild-type embryos) after T7EI digestion, whereas Lanes 3 and 4 are from the injected group after T7EI digestion. As denoted by the broken line, unrelated outcomes on the gel were excluded from the retained results on the gel. (B) Representative image of an agarose gel resulting from the identification of positive colonies (n = 20). The samples with stronger signals (n = 13; marked in red) will be analyzed by the following T7EI assay. M, Marker; con, control group. (C) Representative image of the T7EI assay in (B). The samples with stronger signals (n = 4; marked in red), which indicate potential positive mutations, will be analyzed by DNA sequencing. Lanes 1–13 are from the identified samples in (B), and Lane 14 is from the control (wild-type embryos). (D) The alignment between the mutant sequence of the cgasa gene from the individual selected colony and the wild-type sequence of the cgasa gene in zebrafish. Red, the CRISPR target sequences; green, PAM; yellow, mutations. |
|
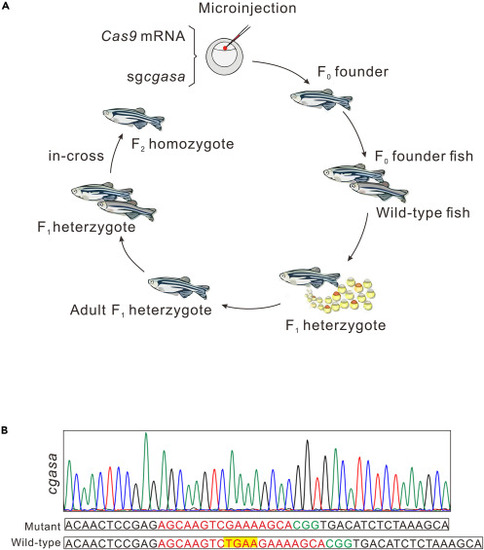
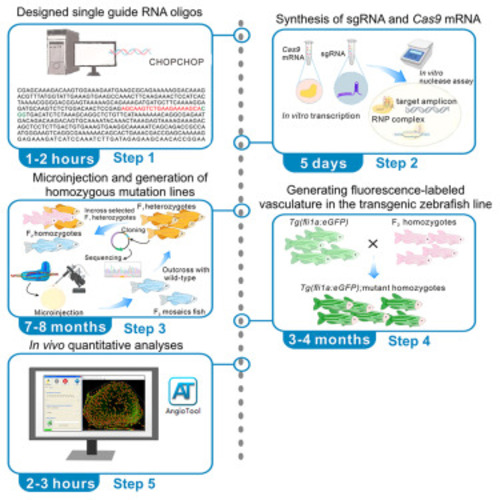
Pipeline from microinjection to generating a zebrafish mutant line |
|
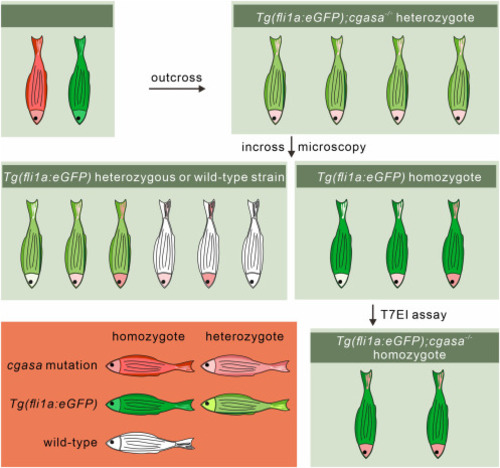
Strategy map for screening the Tg(fli1a:eGFP);cgasa−/− homozygous zebrafish line |
|
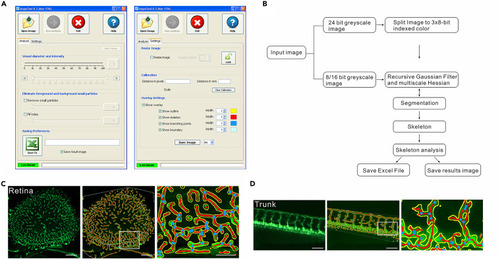
AngioTool was used to analyze vasculature formation in transgenic zebrafish in vivo (A) Software parameter analysis of AngioTool. (B) Representation of the logical analysis flow performed by AngioTool. (C) Representative image and quantification of the retinal vasculature in 1-month-old Tg(fli1a:eGFP) fish. Scale bars, 100 μm. Yellow, outline of the vasculature; red, skeleton of the vasculature; blue, branching points. (D) Representative image and quantification of trunk vasculature in 1-month-old Tg(fli1a:eGFP) fish. Scale bars, 100 μm. Yellow, outline of the vasculature; red, skeleton of the vasculature; blue, branching points. |
|
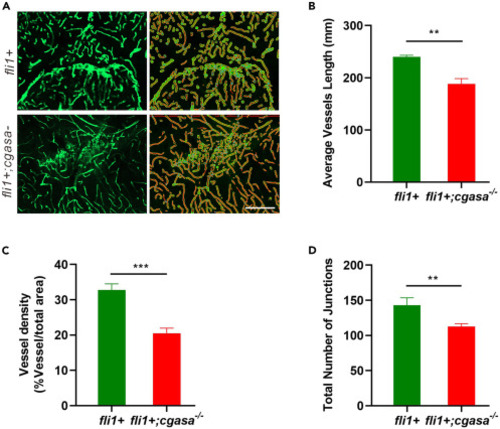
AngioTool was used to analyze brain cortical vasculature formation in Tg(fli1a:eGFP);cgasa−/− and Tg(fli1a:eGFP) fish lines (A) Representative images of brain cortical vasculature in 3-month-old Tg(fli1a:eGFP);cgasa−/− and Tg(fli1a:eGFP) fish. Scale bar, 50 μm. (B–D) Quantitative analyses of average vessel length (B), vessel density (C), and total number of junctions (D) in brain cortices from 3-month-old Tg(fli1a:eGFP);cgasa−/− and Tg(fli1a:eGFP) fish lines. Data are represented as Student’s t-test. ∗∗p < 0.01; ∗∗∗p < 0.001. fli+, Tg(fli1a:eGFP) homozygote; fli1;cgasa−/−, Tg(fli1a:eGFP);cgasa−/− homozygote. |
|
|

