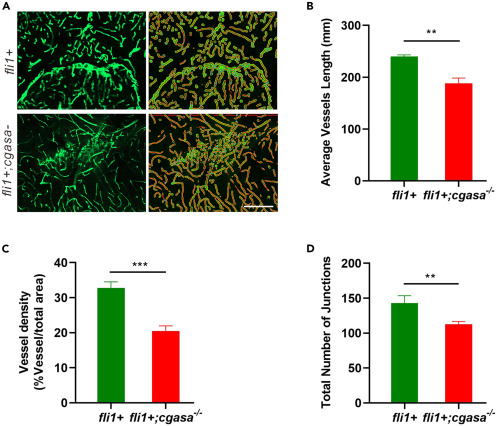
Fig. 7 AngioTool was used to analyze brain cortical vasculature formation in Tg(fli1a:eGFP);cgasa−/− and Tg(fli1a:eGFP) fish lines (A) Representative images of brain cortical vasculature in 3-month-old Tg(fli1a:eGFP);cgasa−/− and Tg(fli1a:eGFP) fish. Scale bar, 50 μm. (B–D) Quantitative analyses of average vessel length (B), vessel density (C), and total number of junctions (D) in brain cortices from 3-month-old Tg(fli1a:eGFP);cgasa−/− and Tg(fli1a:eGFP) fish lines. Data are represented as Student’s t-test. ∗∗p < 0.01; ∗∗∗p < 0.001. fli+, Tg(fli1a:eGFP) homozygote; fli1;cgasa−/−, Tg(fli1a:eGFP);cgasa−/− homozygote.
Image
Figure Caption
Acknowledgments
This image is the copyrighted work of the attributed author or publisher, and
ZFIN has permission only to display this image to its users.
Additional permissions should be obtained from the applicable author or publisher of the image.
Full text @ STAR Protoc

