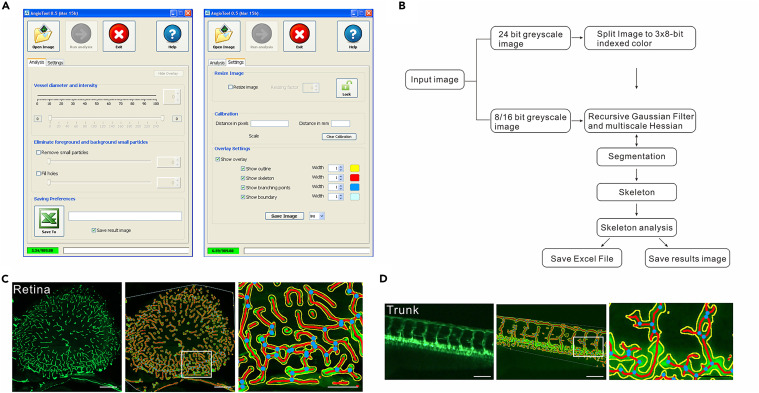
Fig. 6 AngioTool was used to analyze vasculature formation in transgenic zebrafish in vivo (A) Software parameter analysis of AngioTool. (B) Representation of the logical analysis flow performed by AngioTool. (C) Representative image and quantification of the retinal vasculature in 1-month-old Tg(fli1a:eGFP) fish. Scale bars, 100 μm. Yellow, outline of the vasculature; red, skeleton of the vasculature; blue, branching points. (D) Representative image and quantification of trunk vasculature in 1-month-old Tg(fli1a:eGFP) fish. Scale bars, 100 μm. Yellow, outline of the vasculature; red, skeleton of the vasculature; blue, branching points.
Image
Figure Caption
Acknowledgments
This image is the copyrighted work of the attributed author or publisher, and
ZFIN has permission only to display this image to its users.
Additional permissions should be obtained from the applicable author or publisher of the image.
Full text @ STAR Protoc

