FIGURE SUMMARY
Title

Retina-derived signals control pace of neurogenesis in visual brain areas but not circuit assembly

Authors
Sherman, S., Arnold-Ammer, I., Schneider, M.W., Kawakami, K., Baier, H.
Source
Full text @ Nat. Commun.

Transcriptional profiling reveals cell types across central visual areas.

a Maximum z-projection of the HGn12C:GFP expression pattern in green. Transmitted light is in gray. Lines and labels annotate major anatomical brain areas of the larval brain (scale bar = 100 µm). be Gene expression plots of cells embedded in UMAP space (vglut2a, glutamatergic neurons; gad2, GABAergic neurons; gng8, habenula neurons; fabp7a, progenitors). (f) UMAP embedding of all sequenced cells. Color-coding represents different clusters. Text labels adjacent cell classes. UMAP space is the same as in (be). g, h Markers for glutamatergic (top) and GABAergic (bottom) clusters. Color shade represents the average level of marker expression in a cluster (average expression). Dot size represents the percentage of cells expressing the marker in a cluster (percent expressing).

HCR-FISH labeling uncovers the molecular architecture of central visual areas.

Marker genes label cells in distinct anatomical regions. a, cf Substack maximum z-projections of registered HCR-FISH stains. From top to bottom (left): a, c Selected thalamic markers: cort, pth2, crhbp, crhb. d, e Selected pretectal markers: foxb1a, zic1, npy, grm2b. f Selected tectal markers: gjd2b, pou4f2. Alongside each stain are UMAPs (same as in Fig. 1), showing the clustering of glutamatergic (middle) and GABAergic cells (right) that express the marker. UMAPs with no clustered expression were omitted. b In yellow, HGn12C:GFP background stain used for registration (scale bar = 50 µm; applies to all images). For all stains, at least three larvae were imaged. Additional stains and anatomical annotations are available in the zebrafish brain atlas31 at mapzebrain.org. g Gene expression look-up matrix for combined plots.

Cell-type diversity of central visual areas emerges in the absence of retinal input.

a UMAP embedding of different genotypes clustered independently (unrelated WT, left; sibling WT, middle; lakritz, right), color-coded by cluster identity. Clusters are labeled with text. GABAergic clusters express gad2. The remaining clusters, excluding progenitors and precursor neurons, are glutamatergic. b UMAP embedding of all cells color-coded by genetic background. Text labels adjacent cell classes. Clustering of glutamatergic (c) and GABAergic cells (d). Presented side-by-side are WT and lakritz cells of the same clusters. For quantitative analysis, see supplement.

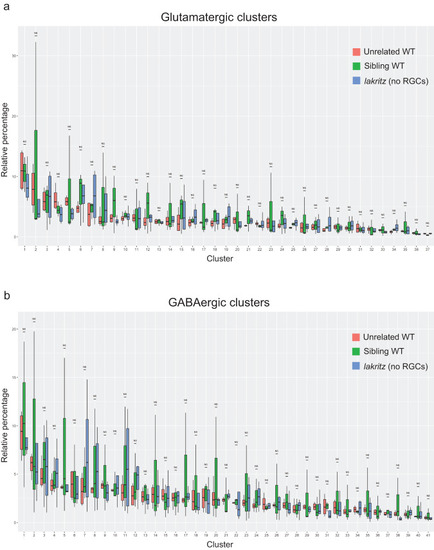
Relative cell-type proportions are largely unchanged in absence of RGCs.

Bar plots showing for each cluster the variance in relative percentages across replicates (a glutamatergic clusters; b GABAergic clusters). For each cluster, the variance is shown for all genotypes (red, unrelated WT; green, sibling WT; blue, lakritz). The p-values were calculated using a two-sided Wilcoxon signed-rank test and corrected for multiple testing using the Bonferroni correction (unrelated WT: n = 4 independent experiments; sibling WT: n = 3 independent experiments; lakritz: n = 4 independent experiments).

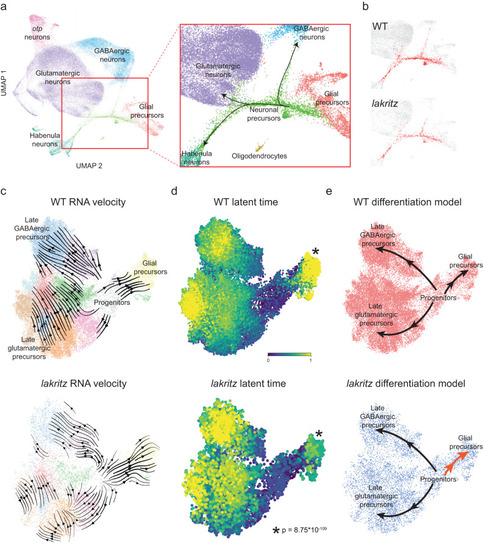
Differentiation trajectories through transcriptomic space are conserved despite absence of RGCs but differ in speed.

A Left, UMAP embedding of all cells, color-coded by cell identity. Text labels adjacent cell classes. Right, enlarged area (red square, left) showing a class of neuronal precursor cells differentiating into major neuronal classes. B Same enlarged area as in (a, right), but highlighting in red neuronal precursors from either WT (top) or lakritz (bottom). Precursors from both groups show similar differentiation paths. C–E Comparison of WT (top) and lakritz (bottom) by trajectory inference analysis. C RNA velocity analysis including mitotic progenitors and postmitotic precursors. Clusters are the same across groups. D Latent time analysis informed by RNA velocity. Initial and terminal states were calculated independently across groups. P-value calculated by comparing latent time for the glial precursor terminal state (asterisk adjacent) between groups using the Wilcoxon signed-rank test. E Simplified models for differentiating progenitors and precursors across groups. In lakritz mutants, precursors show a faster transition (velocity) from progenitors to glial precursors (dark orange arrow).

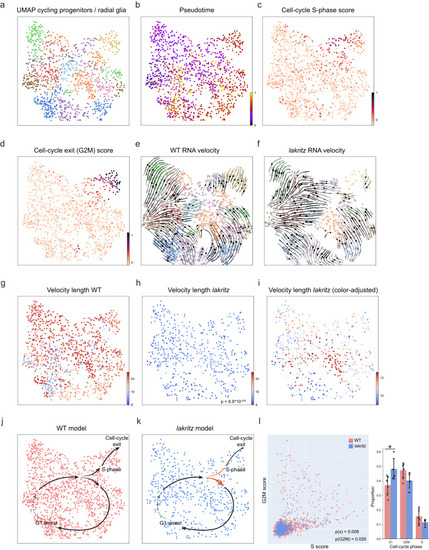
Mitotic progenitors progress more slowly through the cell cycle and exit it at a reduced rate in absence of retinal input.

al Trajectory inference analysis performed on a cluster of mitotic progenitors. a UMAP embedding of cells color-coded by in-subset cluster identity. All subsequent panels use the same UMAP embedding. b Pseudotime analysis shows temporal progression (transition) between neighboring clusters. c, d Cells are color-coded according to their cell-cycle score. c Score of cell-cycle S-phase genes. d Score of cell-cycle G2M-phase genes. G2M high-scoring cells show a putative transition point from mitotic to postmitotic progenitors. RNA velocity analysis performed on WT (e) and lakritz (f) cells independently. RNA velocity show a similar temporal progression across groups. Velocity length inferred from RNA velocity shown for WT (g) and lakritz (h, i) cells. Color scale is the same for both groups in (g, h). i Color-scale adjusted to 5th and 95th percentile of values in the lakritz dataset. Lower velocity length shows that transition speed in lakritz is reduced overall in mitotic progenitors. In (i) higher-scoring cells show a putative bias towards G1 arrest over cell-cycle exit in the lakritz dataset. P-value calculated by comparing velocity length between WT and lakritz using the Wilcoxon signed-rank test. j, k Simplified models for mitotic progenitors across groups. In lakritz, mitotic progenitors show a bias towards G1 arrest over cell-cycle exit (dark orange arrow). Dashed arrow shows a putative transition from G1 arrest to active cycling. l A scatter plot showing the distribution of cell-cycle scores for each cell in the WT (red) and lakritz (blue) datasets. P values were calculated by comparing scores distribution between groups for each axis using the Wilcoxon signed-rank test. In lakritz, a significantly larger proportion of cells show low and negative scores on both axes, suggesting an increase in G1 cells. (Right) Bar plot summarizing the cell-cycle assignment for each cell shows a significant increase in the proportion of G1 cells in the lakritz dataset (p = 0.0376, two-sided Wilcoxon signed-rank test; n = 1333 cells, collected over 11 independent experiments. Data bars are mean ± SD).

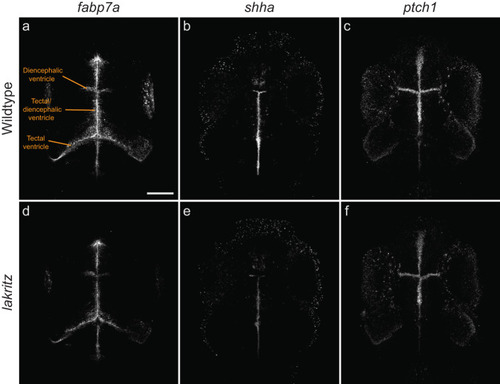
Some developmental markers are dysregulated in the ventricular zones of lakritz mutants.

The zones lining the ventricles (indicated) in the midbrain and forebrain contain proliferative and differentiating cell populations. Overall patterns are unchanged in lakritz mutants (c, d, f) compared to wildtype (WT; a, b, c), although expression levels are altered. See also Table S3. The marker of terminally differentiated glia, fabp7, is downregulated in lakritz mutants (a, d). The genes encoding the mitogen Shha (b, e) and its receptor Patched1 (c, f) are reduced in lakritz mutants. Maximum projections of HCR-FISH labeling patterns from the same co-registered substacks are shown to allow direct comparisons of local expression levels across fish. Scale bar = 100 µm. All experiments were repeated three times with similar results.

Pretectal circuitry is assembled without retinal input to drive proper behavior.

a Single plane from a triple-transgenic larva carrying pvalb6:Gal4, UAS:CoChR-tdTomato, and, for orientation, elavl3:nlsGCaMP6s (scale bar = 50 µm). Right panel shows the zoomed-in field of view (FOV) centered on arborization field 7 (AF7). White arrow points to a single, AF7-connected neuron expressing CoChR-tdTomato. b Fast recordings of optogenetically induced J-turn-like bouts in larvae with and without RGCs (WT, left; atoh7 morphant, right). In gray is an average of the larvae before photostimulation (colors are inverted). In red is a standard deviation time-lapse projection of frames containing a J-turn-like bout. Dashed line contours location of optic fiber (scale bar = 500 µm). c Illustration of experimental setup. Larvae embedded in agarose on a small transparent dish facing screens showing moving gratings, which generate optic flow. A camera records eye movement, and an optic fiber is positioned above the brain area of interest. d Selected images of 6 dpf larvae used for experiment. Maximum z-projection of either WT (left) or lakritz (right) larvae. Fish were from the hypopigmented TLN strain (transmitted light) and were transgenic for isl2b:GFP (green), Gal4s1026t and UAS:ChR2-mCherry (magenta). GFP expression was used to phenotype lakritz mutants (scale bar = 250 µm). e OKR as a function of genotype (lakritz, n = 3) and stimulus conditions, as indicated. The “OKR index” was calculated by counting the saccades in the expected direction and subtracting the saccades in the opposite direction during the stimulation. For spontaneous eye movements, this index hovers around zero. Increase in “OKR index” indicates a response either to perceived motion (in WT) or to successful photostimulation of the pretectum (in WT and lakritz). Data are presented as mean values ± SD. Source data are provided as a Source Data file.

Acknowledgments
This image is the copyrighted work of the attributed author or publisher, and ZFIN has permission only to display this image to its users. Additional permissions should be obtained from the applicable author or publisher of the image. Full text @ Nat. Commun.