
FIGURE
Fig. 4
- ID
- ZDB-FIG-231002-245
- Publication
- Sherman et al., 2023 - Retina-derived signals control pace of neurogenesis in visual brain areas but not circuit assembly
- Other Figures
- All Figure Page
- Back to All Figure Page
Fig. 4
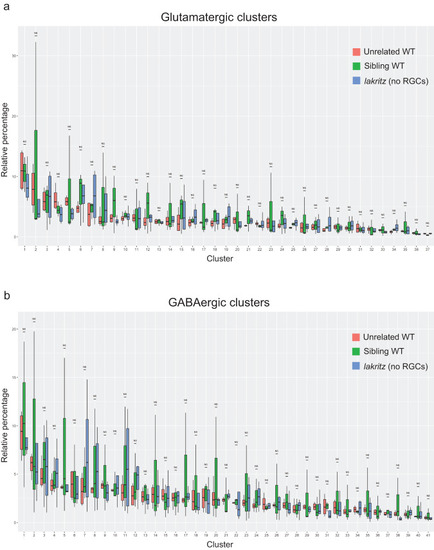
Relative cell-type proportions are largely unchanged in absence of RGCs. Bar plots showing for each cluster the variance in relative percentages across replicates ( |
Expression Data
Expression Detail
Antibody Labeling
Phenotype Data
Phenotype Detail
Acknowledgments
This image is the copyrighted work of the attributed author or publisher, and
ZFIN has permission only to display this image to its users.
Additional permissions should be obtained from the applicable author or publisher of the image.
Full text @ Nat. Commun.