FIGURE

Fig. 5

ID
ZDB-FIG-231002-246
Publication
Sherman et al., 2023 - Retina-derived signals control pace of neurogenesis in visual brain areas but not circuit assembly
Other Figures
All Figure Page
Back to All Figure Page
Fig. 5

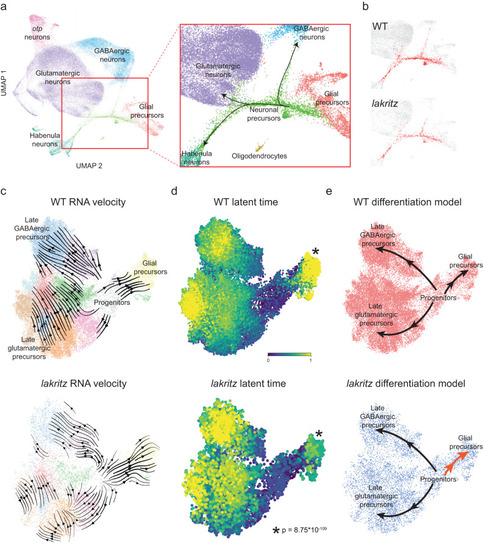
Differentiation trajectories through transcriptomic space are conserved despite absence of RGCs but differ in speed.

A Left, UMAP embedding of all cells, color-coded by cell identity. Text labels adjacent cell classes. Right, enlarged area (red square, left) showing a class of neuronal precursor cells differentiating into major neuronal classes. B Same enlarged area as in (a, right), but highlighting in red neuronal precursors from either WT (top) or lakritz (bottom). Precursors from both groups show similar differentiation paths. C–E Comparison of WT (top) and lakritz (bottom) by trajectory inference analysis. C RNA velocity analysis including mitotic progenitors and postmitotic precursors. Clusters are the same across groups. D Latent time analysis informed by RNA velocity. Initial and terminal states were calculated independently across groups. P-value calculated by comparing latent time for the glial precursor terminal state (asterisk adjacent) between groups using the Wilcoxon signed-rank test. E Simplified models for differentiating progenitors and precursors across groups. In lakritz mutants, precursors show a faster transition (velocity) from progenitors to glial precursors (dark orange arrow).

Expression Data

Expression Detail
Antibody Labeling
Phenotype Data

Phenotype Detail
Acknowledgments
This image is the copyrighted work of the attributed author or publisher, and ZFIN has permission only to display this image to its users. Additional permissions should be obtained from the applicable author or publisher of the image. Full text @ Nat. Commun.