- Title
-
HSP90β prevents aging-related cataract formation through regulation of the charged multivesicular body protein (CHMP4B) and p53
- Authors
- Fu, J.L., Zheng, S.Y., Wang, Y., Hu, X.B., Xiao, Y., Wang, J.M., Zhang, L., Wang, L., Nie, Q., Hou, M., Bai, Y.Y., Gan, Y.W., Liang, X.M., Xie, L.L., Li, D.W.
- Source
- Full text @ Proc. Natl. Acad. Sci. USA
|
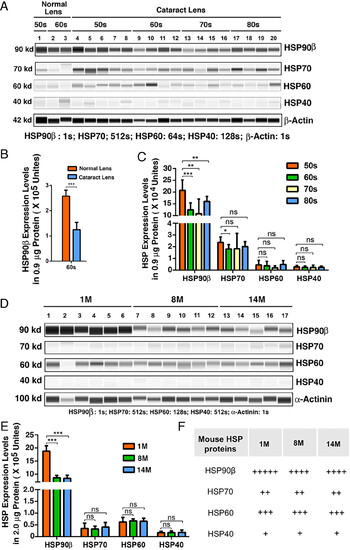
HSP90β is the most dominant HSP in normal human and mouse lenses and becomes significantly down-regulated during human cataractogenesis and aging of mouse lens. (A) The automated western immunoblot (WES) analysis of HSP90β, HSP70 (the HSP70 antibody recognizing both inducible and constitutive isoforms), HSP60 and HSP40 between normal lens and cataract patients in different age groups. Output western blot style data of four HSPs and the β-Actin (as control) with the exposure time indicated. Each lane was loaded 0.9-μg protein. (B) Quantification data derived from the software-calculated average of seven exposures (1-512 s). The quantification results show that HSP90β is significantly down-regulated from normal human lens to cataractous lens of the same age group (60s group including 61- to 69-y-old subjects). (C) Quantification results show the differential expression levels of four HSPs among different age groups of cataract patients (see SI Appendix, Tables S2–S5 for details of different age groups). (D) The WES analysis of HSP90β, HSP70 (the HSP70 antibody recognizing both inducible and constitutive isoforms), HSP60 and HSP40 in mouse lenses of 1-, 8-, and 14-mo-old animals. Output western blot style data of four HSPs and the α-Actinin (as control) with the exposure time indicated. Each lane was loaded 2-μg protein. (E) Quantification data derived from the software-calculated average of seven exposures (1-512s). The quantification results show that HSP90β is significantly down-regulated from normal mouse lens to aged mouse lens (8- to 14-mo). In contrast, other three HSPs display no age-dependent changes. (F) Summary of the WES analysis results of four HSPs in normal and aging mouse lenses. +++++, ++++, +++, ++ and + refer to expression levels of 1 × 10⁶, 1 × 10⁵ to 1 × 10⁶, 5 × 10⁴ to 1 × 10⁵, 3 × 10⁴ to 5 × 10⁴, and less than 3 × 10⁴ units, respectively, in 2-µg total protein. Error bar represents SD. *P < 0.05; **P < 0.01; ***P < 0.001; ns, statistically not significant. |
|
HSP90β is positively regulated by Sp1 and Sp4. (A) A schematic diagram to show: 1) Predicted Sp1/Sp3/Sp4-binding sites in five regions (M1 to M5) of the HSP90β gene core and proximal promoter; 2) the reporter gene constructs covering M1, M1-M2, M1-M3, M1-M4, and M1-M5 regions. (B) HSP90β gene core and proximal promoter activities were tested using pGL3 reporter constructs containing different length of promoter fragments as indicated in Fig. 1A in αTN4-1 cells. (C) Gel mobility shifting assays (EMSA) revealed that Sp1/3/4 can directly bind to the M2 region. The probe sequences are listed in the left, and the two oligos contain either a well-conserved wild-type Sp1/3/4-binding site (WT-M2, Top) or mutated Sp1/3/4-binding sites (MT-M2, Bottom); The super-shifting bands formed by adding anti-Sp1/3/4 antibodies help to determine the overlapping cis-elements for Sp1/3/4 binding. (D) Map of Sp1/3/4-binding sites in HSP90β core and proximal promoter. (E) Western blot analysis showed silence of Sp1 by specific shRNA in mouse lens epithelial cells, αTN4-1 downregulates the expression level of HSP90β. (F) Quantitative results of Western blots (E). (G) Western blot analysis showed silence of Sp3 by specific shRNA in mouse lens epithelial cells, αTN4-1 upregulates the expression level of HSP90beta. (H) Quantitative results of Western blots (G). (I) Western blot analysis showed silence of Sp4 by specific shRNA in mouse lens epithelial cells, αTN4-1 also downregulates the expression level of HSP90beta. (J) Quantitative results of Western blots (I). (K–N) WES analysis of Sp1(K and L) and Sp4(M and N) between normal lens and cataract patients in different age groups. (K) Output western blot style data of Sp1 with exposure time indicated. (L) Quantitative results of Sp1 derived from the software-calculated average of seven exposures (1-512 s) to show the difference of Sp1 expression in human normal and cataract lenses of the 60s age group. (M) Output western blot style data of Sp4 with exposure time indicated. (N) Quantitative results of Sp4 derived from the software-calculated average of seven exposures (1-512 s) to show the difference of Sp4 expression in human normal and cataract lenses of the 60s age group. Error bar represents SD. *P < 0.05; **P < 0.01. |
|
Silence of HSP90βcauses cataractogenesis in zebrafish lens. (A) Two morpholino oligos targeting exon 3 and exon 4 in Zebrafish were designed to silence HSP90β expression. (B) Western blot analysis of HSP90β levels in mock-MO and HSP90β-MO treated 5-d postfertilization (dpf) zebrafish embryo. (C) Morphology of 5 dpf mock-MO (Top) and HSP90β-MO (Bottom) zebrafish larvae. (D) H.E. staining of 5dpf mock-MO (Left) and HSP90β-MO (Right) zebrafish eye by frozen sectioning. (E) Quantification of the ratio between lens and eye size in mock-MO and HSP90β-MO 5dpf zebrafish embryos. (F) Co-IP between HSP90β and CHMP4B, endogenous HSP90β and CHMP4B were precipitated by CHMP4B and HSP90β antibodies, respectively, and detected by western blot analysis. Input protein [0.05% (Top) and 5% (Bottom)] were included as control. (G) For comparison, supernatant samples of IP were also analyzed by western blot. (H) Western blot analysis showed that the expression levels of CHMP4B and Ki67 were clearly up-regulated when HSP90β was silenced by morpholino oligos in zebrafish. (I) IF staining of Ki67 showed that cell proliferation is up-regulated in 5dpf HSP90β-MO zebrafish eye than in mock-MO zebrafish eye. (J) TUNEL labeling assay was used to detect cell apoptosis in zebrafish eye. Compared to 5dpf mock-MO zebrafish, 5dpf HSP90β-MO zebrafish showed significantly more cell apoptosis in lens epithelium. Error bar represents SD. **P < 0.01. PHENOTYPE:
|
|
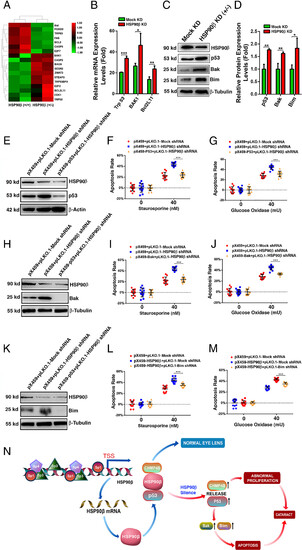
HSP90β prevents stress-induced apoptosis through suppression of the p53-Bak/Bim pathway activation. (A) Hierarchical cluster analysis of apoptosis-associated genes from RNAseq analysis of pX459-HSP90β-αTN4-1 (HSP90β+/−) and pX459-αTN4-1 (HSP90β+/+) cells. (B) qRT-PCR analysis verified the mRNA expression levels of p53, Bak, and Bim in HSP90β (+/+) αTN4-1 cells and HSP90β (+/−) αTN4-1 cells. (C) Western blot analysis of the expression levels of p53, Bak and Bim in HSP90β (+/+) αTN4-1 cells and HSP90β (+/−) αTN4-1 cells. Note that the expression levels of p53, Bak, and Bim were up-regulated with the downregulation of HSP90β. (D) Quantitative results of (C). (E) Western blot analysis of HSP90β and p53 in pX459+pLKO.1 vectors-αTN4-1 cells [HSP90β (+/+)/p53 (+/+)], pX459+pLKO.1-HSP90β shRNA-αTN4-1 cells [HSP90β (+/−)/p53 (+/+)] and pX459-p53+pLKO.1-HSP90β shRNA-αTN4-1 cells [HSP90β (+/−)/p53 (+/−)]. (F and G) Differential apoptosis rates in the above three types of cells without or with treatment by 40 nM staurosporine or 40 mU/mL GO. The cell viability is measured by the Cell Titer-Lumi™ Luminescent Cell Viability Assay Kit. (H) Western blot analysis of HSP90β and Bak in pX459+pLKO.1 vectors-αTN4-1 cells [HSP90β (+/+)/Bak (+/+)], pX459+pLKO.1-HSP90β shRNA-αTN4-1 cells [HSP90β (+/−)/Bak (+/+)] and pX459-Bak+pLKO.1-HSP90β shRNA-αTN4-1 cells [HSP90β (+/−)/Bak (−/−)]. (I and J) Differential apoptosis rates in the above three types of cells without or with treatment by 40 nM staurosporine or 40 mU/mL GO. The cell viability is measured by the Cell Titer-LumiTM Luminescent Cell Viability Assay Kit. (K) Western blot analysis of HSP90β and Bim in pX459+pLKO.1 vectors-αTN4-1 cells [HSP90β (+/+)/Bim (+/+)], pX459+pLKO.1-HSP90β shRNA-αTN4-1 cells [HSP90β (+/−)/Bim (+/+)] and pX459-Bim+pLKO.1-HSP90β shRNA-αTN4-1 cells [HSP90β (+/−)/Bim (−/−)]. (L and M) Differential apoptosis rates in the above three types of cells without or with treatment by 40 nM staurosporine or 40 mU/mL GO. The cell viability is measured by the Cell Titer-Lumi™ Luminescent Cell Viability Assay Kit. Note that knockout of p53, Bak, or Bim attenuates staurosporine- or GO-induced apoptosis in HSP90β (+/−)-αTN4-1 cells, suggesting that HSP90β prevents stress-induced apoptosis through suppression of p53-Bak/Bim pathway activation. (N) Summary of HSP90β regulation and functions in the ocular lens. Under nonstress induction conditions, the dominant expression of HSP90β is mainly regulated by the Sp1 family transcription factors. The high level of HSP90β can interact with CHMP4B, a newly-found client protein, and p53 to maintain normal cell proliferation and survival to keep lens transparency. Silence of HSP90β induces upregulation of CHMP4B and p53. The increased expression of CHMP4B promotes cell proliferation, and accumulation of the excess number of lens epithelial cells without proper differentiation will cause cataractogenesis. On the other hand, p53 upregulation enhances expression of Bim and Bak, triggering apoptosis of lens epithelial cells, leading to cataractogenesis. Error bar represents SD. *P < 0.05; **P < 0.01; ***P < 0.001. |


