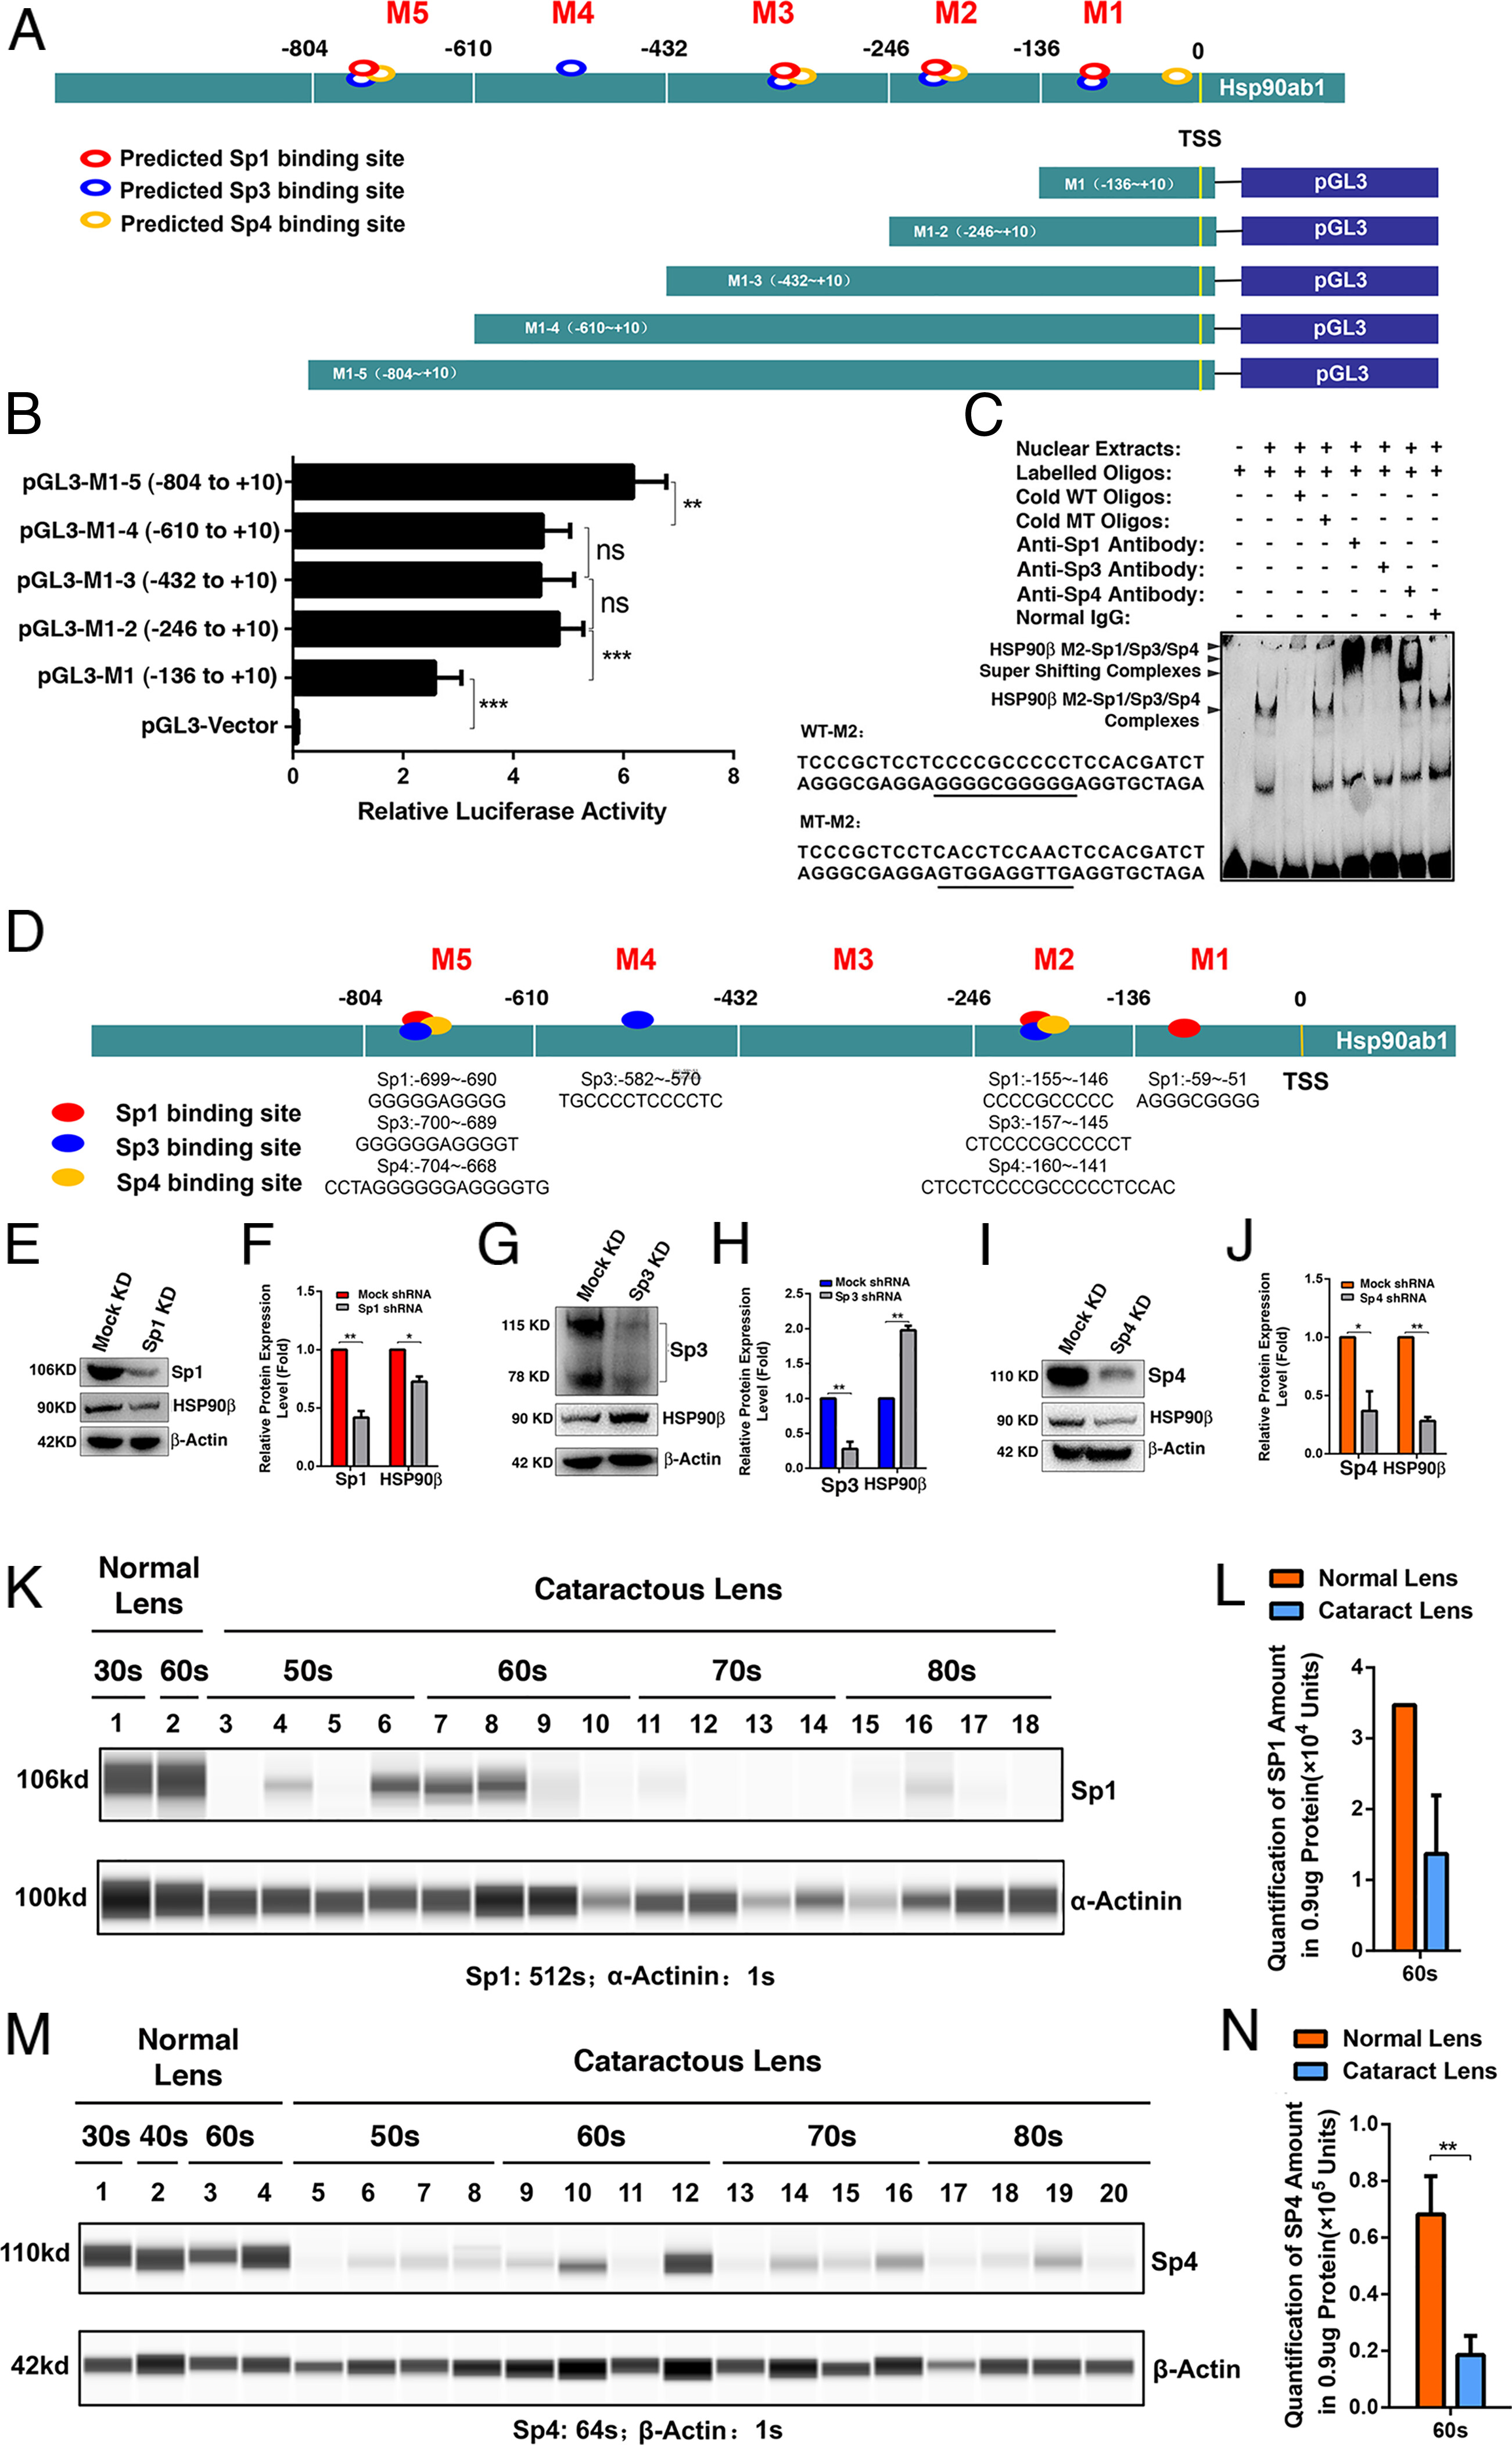
Fig. 2 HSP90β is positively regulated by Sp1 and Sp4. (A) A schematic diagram to show: 1) Predicted Sp1/Sp3/Sp4-binding sites in five regions (M1 to M5) of the HSP90β gene core and proximal promoter; 2) the reporter gene constructs covering M1, M1-M2, M1-M3, M1-M4, and M1-M5 regions. (B) HSP90β gene core and proximal promoter activities were tested using pGL3 reporter constructs containing different length of promoter fragments as indicated in Fig. 1A in αTN4-1 cells. (C) Gel mobility shifting assays (EMSA) revealed that Sp1/3/4 can directly bind to the M2 region. The probe sequences are listed in the left, and the two oligos contain either a well-conserved wild-type Sp1/3/4-binding site (WT-M2, Top) or mutated Sp1/3/4-binding sites (MT-M2, Bottom); The super-shifting bands formed by adding anti-Sp1/3/4 antibodies help to determine the overlapping cis-elements for Sp1/3/4 binding. (D) Map of Sp1/3/4-binding sites in HSP90β core and proximal promoter. (E) Western blot analysis showed silence of Sp1 by specific shRNA in mouse lens epithelial cells, αTN4-1 downregulates the expression level of HSP90β. (F) Quantitative results of Western blots (E). (G) Western blot analysis showed silence of Sp3 by specific shRNA in mouse lens epithelial cells, αTN4-1 upregulates the expression level of HSP90beta. (H) Quantitative results of Western blots (G). (I) Western blot analysis showed silence of Sp4 by specific shRNA in mouse lens epithelial cells, αTN4-1 also downregulates the expression level of HSP90beta. (J) Quantitative results of Western blots (I). (K–N) WES analysis of Sp1(K and L) and Sp4(M and N) between normal lens and cataract patients in different age groups. (K) Output western blot style data of Sp1 with exposure time indicated. (L) Quantitative results of Sp1 derived from the software-calculated average of seven exposures (1-512 s) to show the difference of Sp1 expression in human normal and cataract lenses of the 60s age group. (M) Output western blot style data of Sp4 with exposure time indicated. (N) Quantitative results of Sp4 derived from the software-calculated average of seven exposures (1-512 s) to show the difference of Sp4 expression in human normal and cataract lenses of the 60s age group. Error bar represents SD. *P < 0.05; **P < 0.01.
Image
Figure Caption
Acknowledgments
This image is the copyrighted work of the attributed author or publisher, and
ZFIN has permission only to display this image to its users.
Additional permissions should be obtained from the applicable author or publisher of the image.
Full text @ Proc. Natl. Acad. Sci. USA

