FIGURE SUMMARY
Title

Defective neurite elongation and branching in Nibp/Trappc9 deficient zebrafish and mice

Authors
Hu, M., Bodnar, B., Zhang, Y., Xie, F., Li, F., Li, S., Zhao, J., Zhao, R., Gedupoori, N., Mo, Y., Lin, L., Li, X., Meng, W., Yang, X., Wang, H., Barbe, M.F., Srinivasan, S., Bethea, J.R., Mo, X., Xu, H., Hu, W.
Source
Full text @ Int. J. Biol. Sci.

ZFIN is incorporating published figure images and captions as part of an ongoing project. Figures from some publications have not yet been curated, or are not available for display because of copyright restrictions.

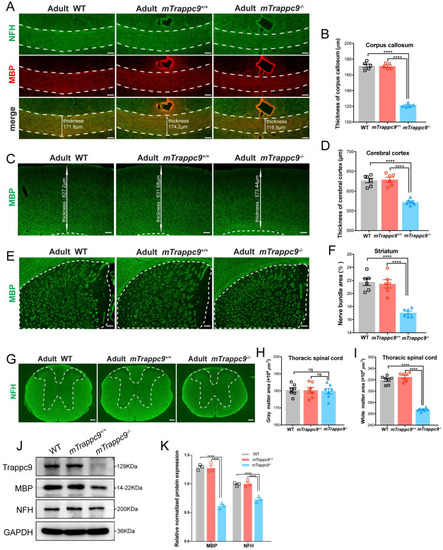
White matter and cerebral cortex are reduced in adult mTrappc9 deficient mice. (A-B), NFH (axonal tracts) and MBP (myelin) immunostaining of the corpus callosum sections. Compared with WT (C57BL/6 wildtype) and mTrappc9+/+, the corpus callosum (highlighted with white dotted lines) of mTrappc9m/m mice was significantly thinner. Representative images with indicated thickness from n=3 mice/group (A), and quantitative analysis of n=5 sections (B). (C-D), MBP immunostaining of the cerebral cortex sections, with the white line arrows defining the representative thickness of the cerebral cortex (C, n=3 mice). Quantification shows the cortex is significantly thinner in mTrappc9 m/m mice than the other two groups (D, n=6 sections). (E-F), MBP immunostaining of the striatum. The white dotted lines demarcate the striatum area (E, n=3 mice) for quantification of the coverage area of the nerve bundles in the striatum (F, n=6 sections), which shows that nerve bundles are significantly reduced in mTrappc9 m/m mice compared to WT and mTrappc9+/+ mice. (G-I), NFH immunostaining of spinal cord sections. In mTrappc9 m/m mice, there was no significant difference in gray matter (inside the white dotted line), but the area of white matter (outside the white dotted line) was reduced significantly. Representative images from n=3 mice/group (G); n=7 sections (H, I). (J-K), Western blot analysis of MBP and NFH protein expression in cerebral cortex normalized with GAPDH. Both showed a significant decrease in mTrappc9 m/m mice. n=3 mice/group. Data are means ± SEM; One-way ANOVA (B, D, F, H, I); Two-way ANOVA (K); ****P≤0.0001; ns, not significant (P>0.05). Scale bars: 50 μm (A); 150 μm (C, E, G).

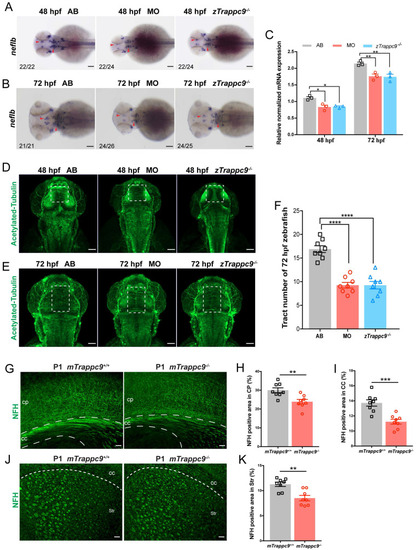
The axonal tracts of early developing mice and zebrafish are reduced after Trappc9 loss-of-function. (A-C), RNA in situ hybridization and RT-qPCR analysis of neflb mRNA expression in mutant (zTrappc9m/m) and morphant (MO) zebrafish embryos at 48 and 72 hpf. The red arrowheads point to the expression of neflb in the midbrain and hindbrain of zebrafish embryos. Both showed a decrease of neflb mRNA in MO and zTrappc9m/m zebrafish embryos. Representative images from n=20-26 embryos/group in 7 experiments (A, B); n=3 experiments (C). (D-F), Acetylated-α-tubulin immunostaining of zebrafish embryos at 48 and 72 hpf to label axonal tracts. The dotted square lines indicate intertectal fascicles and commissures. (F) Statistical analysis of the number of internal fascicles and commissure of zebrafish at 72 hpf in (E). The number of axonal tracts in MO and zTrappc9m/m zebrafish were significantly reduced compared to wildtype AB line. Representative images from n=10 embryos/group in 4 experiments (D, E); n= 8 embryos (F). (G-K), NFH immunostaining of neonatal mouse cerebral cortex (CP)/corpus callosum (CC), and striatum (Str). The axonal tracts of mTrappc9m/m mice were significantly fewer than mTrappc9+/+ mice in CP (H), CC (I) and Str (K). Representative images from n=4 mice/group (G, J); n=8 sections (H, I, K). Data are means ± SEM; t-tests (H, I, K); One-way ANOVA (F); Two-way ANOVA (C); ****P≤0.0001; ***P≤0.001; **P≤0.01; *P≤0.05; Scale bars: 50 μm (A, B, D, E, G, J).

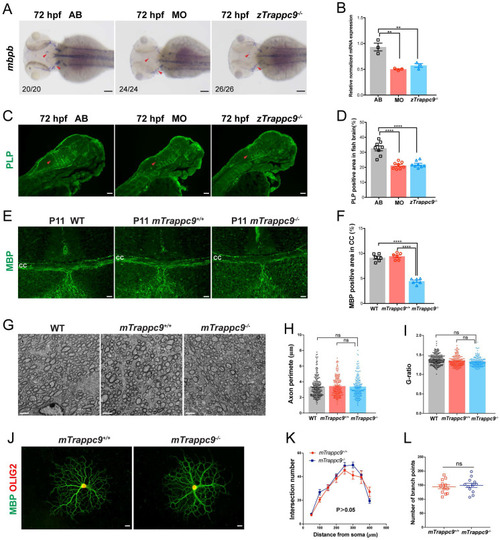
Myelin sheath in early developing mice and zebrafish is reduced after Trappc9 deficiency, but the myelin sheath formation was not affected. (A-B), RNA in situ hybridization and RT-qPCR analysis of mbpb expression in 72 hpf zebrafish embryos. The expression of mbpb in mutant (zTrappc9m/m) and morphant (MO) zebrafish at 72 hpf was significantly reduced. Representative images from n=20-26 embryos/group in 7 experiments (A); n=3 experiments (B). (C-D), PLP immunostaining of 72 hpf zebrafish embryos. The area percentage of PLP fluorescence in zebrafish hindbrain (red arrowheads) was significantly decreased in MO and zTrappc9m/m zebrafish embryos. Representative images from n=10 embryos/group (C); n=8 sections (D). (E-F), MBP immunostaining of P11 mouse cerebral cortex, showing the area percentage of MBP fluorescence in the corpus callosum was significantly decreased in mTrappc9m/m mice. Representative images from n=3 mice/group I; n=6 sections (F). (G-I), Transmission electron microscope (TEM) micrographs of adult mouse corpus callosum showing no significant difference in the axon perimeter (H) and G-ratio (I) in mTrappc9m/m mice. Representative images from n=13 sections/group (G); n=200-220 myelinated axons (H, I). (J-L), MBP and OLIG2 immunostaining of primary cultured oligodendrocytes, which were differentiated from brain-derived oligodendrocyte precursor cells (OPCs) of P8 mice. The morphology (sholl analysis, K) and branch numbers (L) of oligodendrocytes were not affected by mTrappc9 deficiency. Representative images from n=3 coverslips/group (J); n=6 neurons (K); n=12 neurons (L). Data are means ± SEM; t-tests (L); One-way ANOVA (B, D, F, H, I); Two-way ANOVA (K); ****P≤0.0001; **P≤0.01; ns, not significant (P>0.05). Scale bars: 2 μm (G); 10 μm (J); 50 μm (A, C, E).

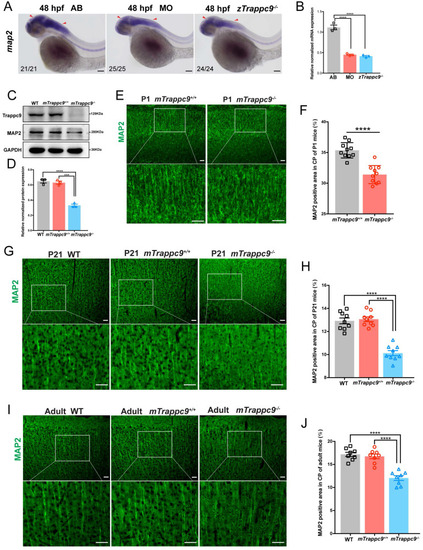
Dendrites of neurons are reduced after Trappc9 loss-of-function. (A-B), RNA in situ hybridization and RT-qPCR analysis of map2 mRNA expression in 48 hpf zebrafish embryos. The expression of map2 was reduced in mutant (zTrappc9m/m) and morphant (MO) zebrafish embryos. Representative images from n=20-25 embryos/group in 5 experiments (A); n=3 experiments (B). (C-D), Western blot analysis of MAP2 in adult mouse cerebral cortex showing significant reduction in the integrated density of MAP2 protein bands normalized with GAPDH. n=3 mice/group. (E-F), MAP2 immunostaining of neonatal (P1) mouse cerebral cortex showing a significant decrease in the area ratio of MAP2 fluorescence. Representative images from n=3 mice/group (E); n=10 sections (F). (G-H), MAP2 immunostaining of P21 mouse cerebral cortex showing a significant decrease in the area ratio of MAP2 fluorescence. Representative images from n=3 mice/group (G); n=9 sections (H). (I-J), MAP2 immunostaining of adult mouse cerebral cortex showing a significant decrease in the area ratio of MAP2 fluorescence. Representative images from n=3 mice/group (I); n=8 sections (J). Data are means ± SEM; t-tests (F); One-way ANOVA (B, D, H, J); ****P≤0.0001; ***P≤0.001; Scale bars: 50 μm (A, E, G, I).

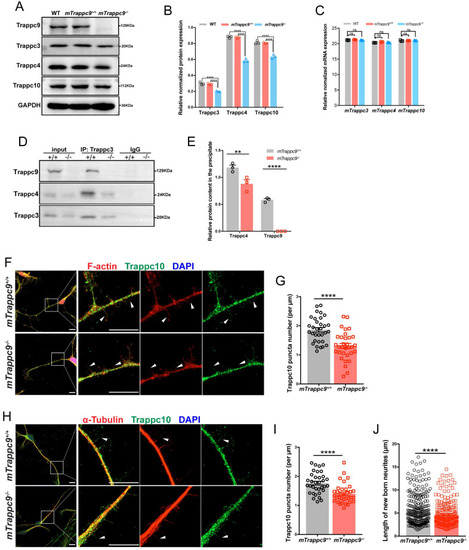
The distribution of Trappc10 along microfilaments and microtubules is reduced after mTrappc9 deficiency. (A, B), Western blot analysis of mTrappc3/4/9/10 in adult mouse cerebral cortex showing a significant decrease in the integrated density of protein bands normalized with GAPDH. n=3 mice/group. (C), RT-qPCR analysis of Trappc3, Trappc4, Trappc10 showing no significant differences. n=3 mice/group. (D, E), Co-immunoprecipitation with Trappc3 antibody. Trappc3 can pull down full-length mTrappc9 in the brain tissue lysate from mTrappc9+/+ mice, but not mTrappc9 m/m mice. Trappc4 can be co-immunoprecipitated by Trappc3 in mTrappc9+/+ mice but was significantly reduced in the co-precipitate of mTrappc9 m/m mice. n=3 mice/group. Quantitative data represent the ratio of precipitated protein over corresponding input for normalization. (F-I), Trappc10 and F-actin/α-tubulin immunostaining of mouse NSC-differentiated neurons cultured for 6 days showing significant decrease in the Trappc10 puncta number per micron of nascent neurites. Arrowheads indicated several nascent neurites, which showed the distribution of Trappc10 reduced in mTrappc9m/m neurons compared to mTrappc9+/+. Representative images from n=8 coverslips/group (F, H); n=32 nascent neurites (G, I). (J), Statistics of the length of nascent neurites in mTrappc9+/+ and mTrappc9m/m neurons. The nascent neurites of mTrappc9m/m are shorter than mTrappc9+/+. n=231 nascent neurites. Data are means ± SEM; t-tests (G, I, J); Two-way ANOVA (B, C, E); ****P≤0.0001; **P≤0.01; ns, not significant (P>0.05). Scale bars: 10 μm (F, H).

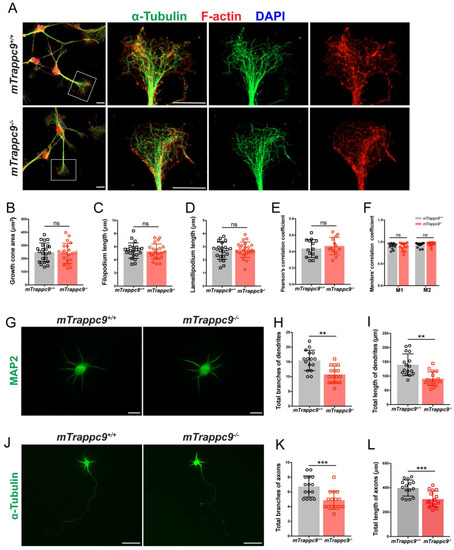
The length and branches of nerve tracts are reduced after Trappc9 deficiency in vitro. (A-F), F-actin and α-tubulin immunostaining of mouse NSC-differentiated neurons cultured for 6 days. (B) Growth cone size; (C) length of filopodium; (D) length of lamellipodium; (E) /(F) Pearson's/Manders' correlation coefficient of F-actin and α-tubulin in growth cone, respectively. mTrappc9m/m mouse neuronal growth cones had normal morphology. Representative images from n=3 coverslips/group (A); n=22 growth cones (B-D); n=14 growth cones (E-F). (G-I), Dendrites of primary neurons from E17.5 mouse cerebral cortex cultured for 6 days labeled by MAP2. Both total branch points (H) and total lengths (I) of dendrites were significantly reduced in mTrappc9m/m neurons. Representative images from n=4 coverslips/group (G); n=16 neurons (H, I). (J-L), Axons of primary neurons from E17.5 mouse cerebral cortex cultured for 6 days labeled by α-tubulin. Both total branch points (K) and total length (L) of axons were significantly reduced in mTrappc9m/m neurons. Representative images from n=4 coverslips/group (J); n=15 neurons (K, L). Data are means ± SEM; t-tests (B, C, D, E, H, I, K, L); Two-way ANOVA (F); ***P≤0.001; **P≤0.01; ns, not significant (P>0.05). Scale bars: 10 μm (A, G); 50 μm (J).

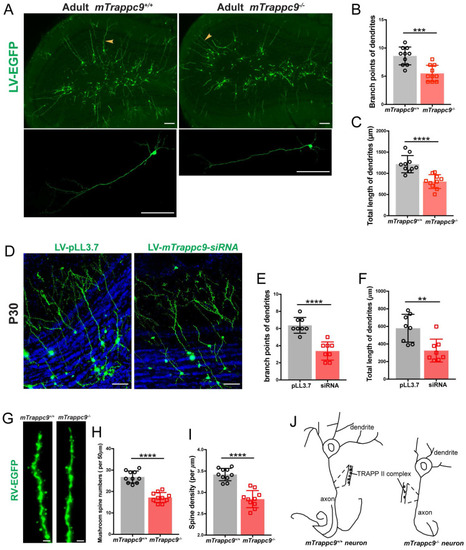
The length and branches of nerve tracts are reduced after Trappc9 deficiency in vivo. (A-C), Lentivirus-EGFP labeled neurons in olfactory bulb of adult mTrappc9+/+ and mTrappc9 m/m mice. Lower panel shows the amplification result with arrowheads indicating relatively complete neurons. Lentivirus-EGFP was injected into the SVZ of adult mouse brain (2-3 months old), and one month later the EGFP-positive cells were examined. Branch points (B) and total lengths (C) of dendrites per neuron in the external plexiform layer were quantified. Neurons had smaller branches and shorter lengths in mTrappc9m/m mice compared to mTrappc9+/+mice. Representative images from n=4 mice/group (A); n=10 neurons (B, C). (D-F), Lentivirus-mediated siRNA knock-down in olfactory neurons in neonatal WT mice. The lentivirus carrying scrambled or mTrappc9-targeting siRNA expression cassette was injected intracerebroventricularly in P1 WT mice, and one month later the EGFP-positive cells were examined. The branch points (E) and total lengths (F) of dendrites in external plexiform layer were reduced in mTrappc9 knock-down mice. Representative images from n=3 mice/group (D); n=8 neurons (E, F). (G-I), Retrovirus-EGFP labeled dendrites in hippocampal dentate gyrus of adult mTrappc9m/m and mTrappc9+/+ mice. (H) Mushroom spine numbers of 50 μm terminal ends in labeled neurons; (I) the spine density. Dendritic spines were reduced in mTrappc9m/m mice. Representative images from n=3 mice/group (G); n=10 neurons (H, I). (J) Graphical illustration depicting the effect of TRAPPII complex on neuronal development. Data are means ± SEM; t-test (B, C, E, F, H, I); ****P≤0.0001; ***P≤0.001; **P≤0.01; Scale bars: 150 μm (A); 50 μm (D); 0.5 μm (G).

Acknowledgments
This image is the copyrighted work of the attributed author or publisher, and ZFIN has permission only to display this image to its users. Additional permissions should be obtained from the applicable author or publisher of the image. Full text @ Int. J. Biol. Sci.